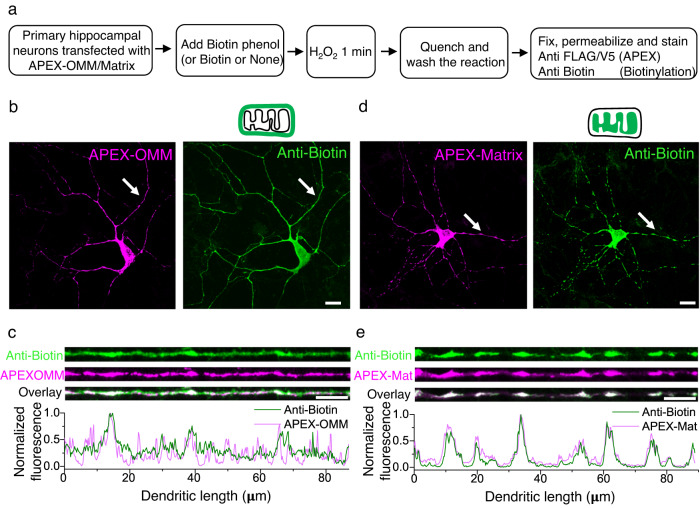
Fig. 1. APEX strategy to label proteins interacting with neuronal mitochondria.
a Experimental workflow for APEX-based proteome labeling of the mitochondrial outer membrane (OMM) and mitochondrial matrix. b Representative images showing APEX expression on the OMM (magenta) and the biotinylated proteome (green). Total n: 9 neurons, 2 animals. Scale bar, 20 μm. c Line profiles of the respective dendrites pointed in (b) (white arrows) show diffused biotin labeling with APEX-OMM. Scale bar 10 μm. d Representative images showing APEX expression within the matrix (magenta) and the biotinylated proteome (green). Scale bar, 20 μm. Total n: 60 neurons, 5 animals. e Line profiles of the respective dendrites pointed in (d) (white arrows) show spatially confined biotin labeling compared to APEX-OMM in (c). Scale bar 10 μm. Source Data files are provided.

