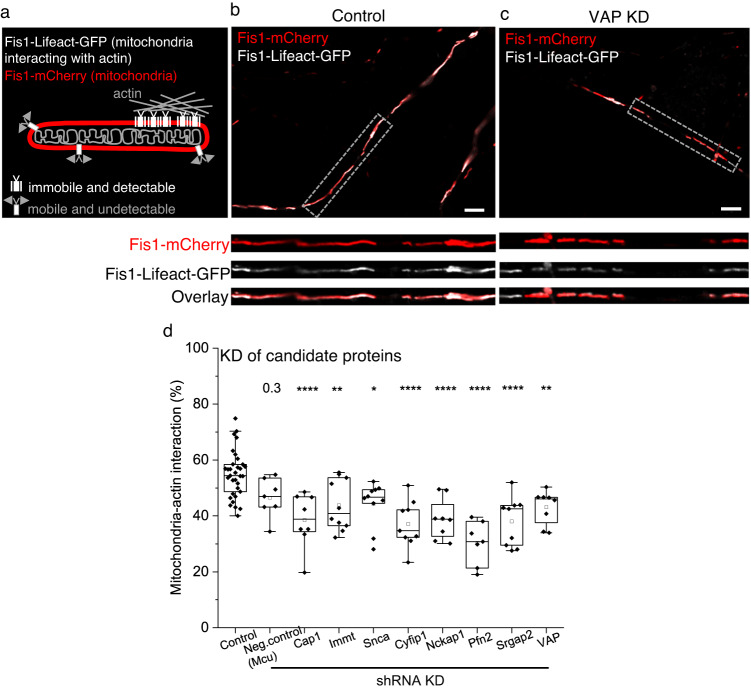
Fig. 3. Identifying proteins required for mitochondria-actin tethering in dendrites.
a Cartoon illustrating the labeling strategy for visualizing mitochondria and mitochondria-actin interaction regions. Representative Airyscan confocal image (of d) of a neuronal dendrite transfected with Fis1-mCherry (red), Fis1-Lifeact-GFP (white), and Control shRNA (b, Control) or VAP shRNA (c, VAP KD) showing fewer mitochondrial regions interacting with actin (white) in VAP KD (c) compared to Control (b). The gray dashed box depicts the straightened dendritic segment magnified for better visualization (inset). Scale bar, 5 μm. d Significant reduction in the average mitochondria-actin interaction percentage in all 8 protein knockdown conditions compared to Control shRNA-expressing dendrites. The mitochondrial uniporter (Mcu) was used as a negative Control, given its localization in the mitochondrial inner membrane and the absence of any known actin association. n in dendrites, animals: 33, 18 (Control), 7, 2 (Neg. control), 8, 3 (Cap1), 10, 4 (Immt), 10, 6 (Snca), 9, 1 (Cyfip1), 8, 2 (Nckap1), 7, 2 (Pfn2), 9, 6 (Srgap2), 8, 5 (VAP). One-way ANOVA, Tukey test, p-values: 0.31 (Neg. control), 8.75 ×10⁻⁵ (Cap1), 0.01 (Immt), 0.02 (Snca), 4.71 × 10⁻⁶ (Cyfip1), 1.36 × 10⁻⁴ (Nckap1), 2.97 × 10⁻⁸ (Pfn2), 1.65 × 10⁻⁵ (Srgap2), and 0.01 (VAP). Source Data files are provided.

