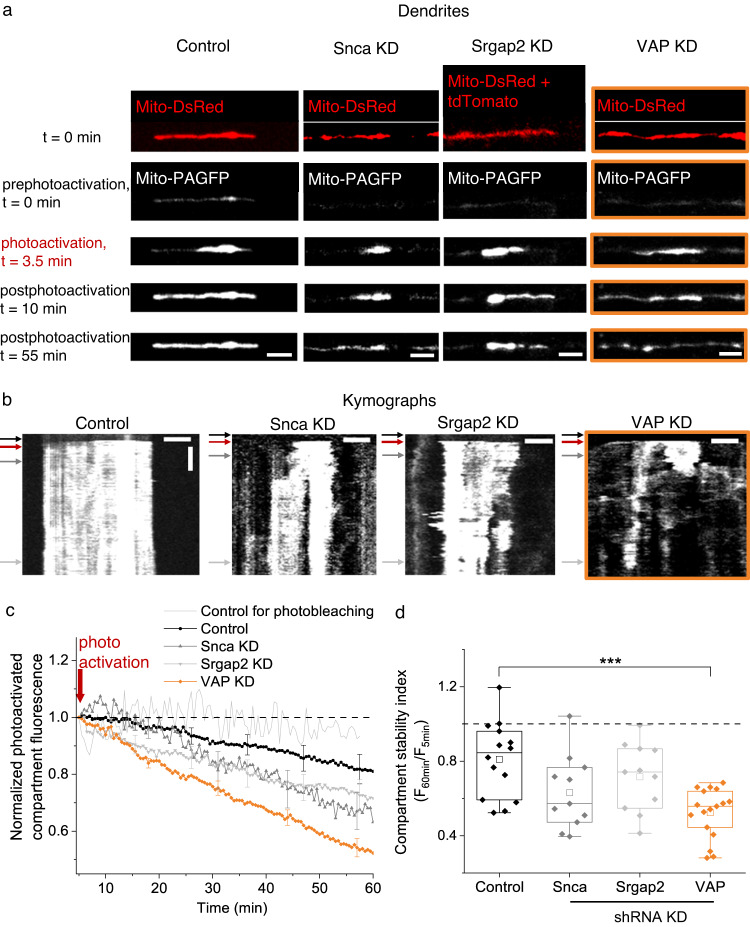
Fig. 4. VAP spatially stabilizes mitochondria in dendrites.
a Representative images (of c, d) of straightened dendrites expressing Mito-DsRed (red), Mito-PAGFP (white) and Control shRNA (Control), Snca shRNA (Snca KD), Srgap2 shRNA (Srgap2 KD) or VAP shRNA (VAP KD, orange box) before (prephotoactivation, t = 0 min), at (photoactivation, t = 3.5 min), and after photoactivation (postphotoactivation t = 10 min, 55 min). The Mito-DsRed signal was used to locate mitochondria for photoactivation at t = 0 min. In Srgap2 KD dendrites, the Mito-DsRed signal is contaminated by the cytosolic tdTomato signal coexpressed by the Srgap2 shRNA plasmid. Scale bar, 5 μm. b Representative kymographs (of c, d) of the photoactivated mitochondrial compartments in (a) show stable mitochondrial compartments in Control; shortened and modest destabilization of mitochondrial compartments in Snca and Srgap2 KD; and shortened and destabilized mitochondrial compartments in VAP KD (orange box). The black arrow denotes the prephotoactivation, the red arrow denotes the photoactivation, and the dark and light gray arrows denote the postphotoactivation time points. Horizontal scale bar, 5 μm. Vertical scale bar, 10 min. c The average time course of photoactivated mitochondrial compartment fluorescence shows a modest decrease in Control (black), a moderate decrease that was not statistically significant in Snca (gray) and Srgap2 KD (light gray), and a dramatic and statistically significant decrease in VAP KD (orange). n in dendrites, animals: 14, 3 (Control), 11, 2 (Snca KD), 11, 2 (Srgap2 KD), 17, 4 (VAP KD). While reduction in photoactivated compartment fluorescence could be due to continuity between mitochondria due to fusion, this is minimal in Control; and in VAP KD, the mitochondria are shorter, perhaps due to decreased fusion (see Discussion). Control for photobleaching (light gray without symbol, n: 4 regions, 3 animals) was measured from static, photoactivated mitochondrial regions, showed a negligible decrease, suggesting minimal photobleaching during imaging. The red arrow denotes the photoactivation time point. d The mitochondrial compartment stability index showed a statistically significant decrease in VAP KD dendrites compared to Control, Snca KD, and Srgap2 KD. n: same as in (c). One-way ANOVA, Tukey test, p-value: 2.3 × 10⁻⁴. Source Data files are provided.

