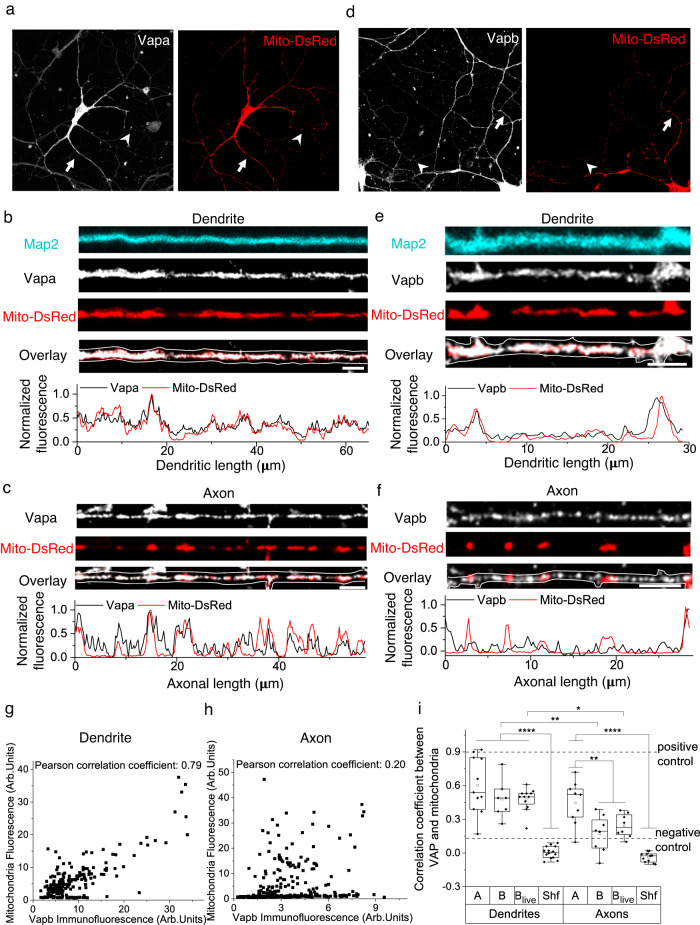
Fig. 5. Vapb is enriched near mitochondria in dendrites but not in axons.
Representative images (of i) of neurons immunostained for Vapa (white) and mitochondria (Mito-DsRed, red) (a); and Vapb (white) and mitochondria (Mito-DsRed, red) (d). Arrows depicting dendrites and arrowheads depicting axons, straightened and magnified for better visualization in (b–f). Representative line profiles (of i) showing local enrichment of Vapa near dendritic (b, arrow in a) and axonal mitochondria (c, arrowhead in a) and Vapb near dendritic (e, arrow in d) but not near axonal mitochondria (f, arrowhead in d). Map2 (cyan) was used to trace the dendrite, and the Vapa and Vapb signal was used to trace the axon (white lines). Vapa and Vapb antibodies were validated in Vapa and Vapb knockdown neurons, respectively. Scale bar, 5 μm. Representative correlation (of i) between individual fluorescent pixel intensities of mitochondria (Mito-DsRed) and Vapb show a strong correlation in the dendrite (g) but not in the axon (h). i The average correlation coefficient measured shows a strong correlation between mitochondria and Vapa (A), Vapb (B) in fixed dendrites, and Vapb in live dendrites (Blive, Vapb-emerald), compared to shuffled control (Shf, see Methods). In axons, a strong correlation between mitochondria and A was observed, but not between mitochondria and B and Blive compared to Shf. Furthermore, the correlation coefficient between Vapb (B and Blive) and mitochondria in dendrites is statistically significant compared to that in axons. n in dendrites, animals: 11, 2 (A), 7, 3 (B), 12, 4 (Blive), 14, 4 (Shf). n in axons, animals: 9, 2 (A), 8, 2 (B), 5, 1 (Blive), 11, 3 (Shf). One-way ANOVA, Tukey test, p-values: 0.00261 (B den versus ax), 0.01644 (Blive den versus ax), <0.0001 (A, B, Blive den versus Shf den), <0.0001 (A ax vs Shf ax), 0.00338 (A ax vs B and Blive ax). As a positive control, the correlation between two different fluorescent tags targeted to the mitochondrial matrix (Mito-DsRed and Mito-PAGFP) was used, which provided the upper limit of the correlation coefficient. As a negative control, the correlation between a mitochondrial (Mito-DsRed) and a non-mitochondrial tag was used for the lower limit of the correlation coefficient. Source Data files are provided.

