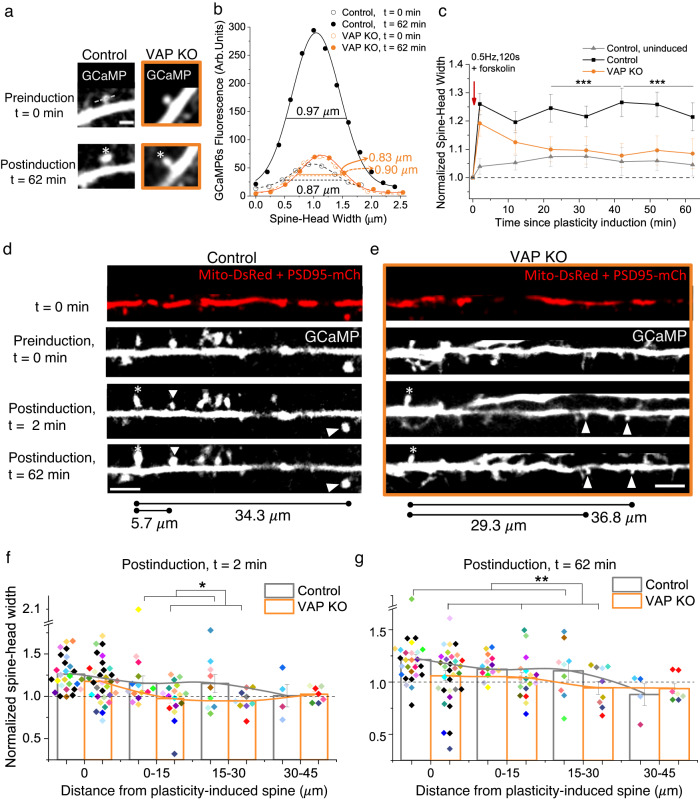
Fig. 6. VAP’s absence affects synaptic and clustered synaptic plasticity.
a Representative plasticity-induced spine (white asterisk) (of c, f, g) measured at 0 and 62 min showed an increase in spine-head width in Control but not in VAP KO. Scale bar, 2 μm. b GCaMP fluorescence along the line crossing the spine-head center (gray dashed line in a) to measure spine-head width in Control (black) and VAP KO spines (orange), before (empty circles, t = 0 min) and after plasticity induction (full circles, t = 62 min). c The average time course showed an increase in spine-head width in Control (black) but not in VAP KO (orange) at 62 min post-spine plasticity induction and in Control, uninduced spines (gray). n in spines, animals: 27, 11 (Control), 33, 7 (VAP KO), 19, 5 (Control, uninduced). One-way ANOVA, Tukey test, p-values: 8.77 × 10⁻⁴ (22-42 min) and 3.36 × 10⁻⁴ (42–62 min). Paired sample t-test between t = 2 and 62 min in VAP KO, p values: 0.06 (normalized data), 0.04 (unnormalized). d, e Representative plasticity-induced spines (white asterisk) (of f, g) measured at 0, 2, and 62 min showed an increase in spine-head width in plasticity-induced and adjacent, PSD95- or Homer2-positive, uninduced spines (white arrowhead) within 30 μm in Control neurons. VAP KO neurons exhibited structural plasticity in the plasticity-induced spine (white asterisk) 2 min postinduction but not in adjacent, uninduced spines (white arrowhead) and 62 min postinduction. Scale bar, 5 μm. f, g Histograms showing an increase in spine-head width 2 and 62 min post-plasticity induction, within 30 μm from plasticity-induced spines, in Control (gray) and 2 min post-plasticity induction in VAP KO (orange) (f), but not in adjacent spines and 62 min post-plasticity induction in VAP KO (orange) (g). Individual points represent spines and are color-coded by neurons. For Control, n in spines, animals: 27, 11 (0 μm), 14, 8 (0–15 μm); 9, 5 (15–30 μm); 4, 2 (30–45 μm). For VAP KO, n in spines, animals: 32, 7 (0 μm); 17, 4 (0–15 μm); 9, 5 (15–30 μm); 7, 4 (30–45 μm). One-way ANOVA, Tukey test, p-values: 0.031 (f), 0.003 (g). Source Data files are provided.

