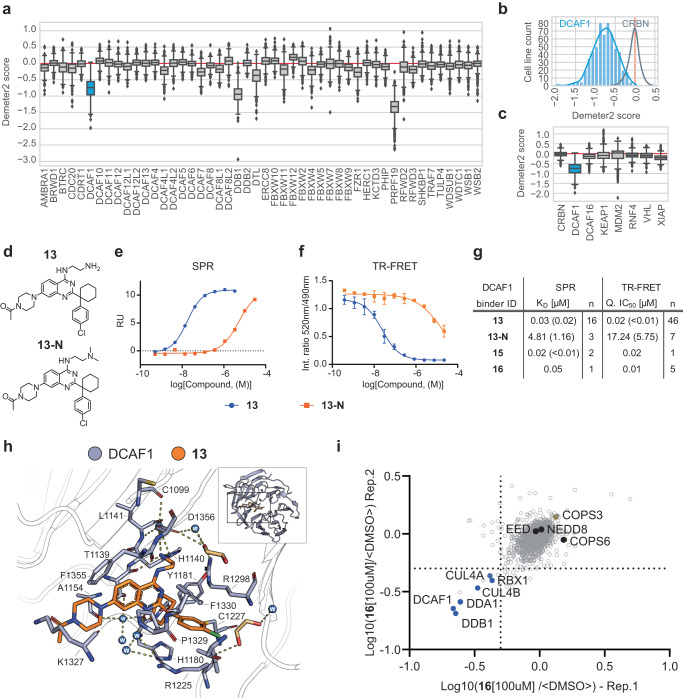
Fig. 1. DCAF1 ligand characterization for targeted protein degradation.
a RNAi gene effect score (Demeter2) extracted for WDR domain containing E3 ligases. Sample sizes represented by these scores range from a maximum 711 (DDB1) to a minimum 343 (FBXW12) cell line counts out of a maximum possible 712 cell lines. The complete list of these gene-sample counts is summarized in the Source data file. Box plots representing the interquartile range (IQR). The top and bottom of the box represent the 75 and 25th percentiles of the data, respectively, with a central line representing the median. Whiskers extend to the upper and lower fences: Upper fence = Q3 + (1.5 × IQR), Lower fence = Q1 − (1.5 × IQR). Outliers are depicted as individual diamond-shaped points beyond the upper and lower fences. b Histograms depicting Demeter2 scores per # of cell lines for CRBN (gray) and DCAF1 (blue). c Demeter2 scores for selected E3 ligases. Box size definitions are the same than for (a). d Structure of DCAF1 binder (13) and the control compound (13-N). e SPR binding data of surface immobilized DCAF1(WDR) and (13, blue) and (13-N, orange) as analytes. f TR-FRET assay binding data of DCAF1(WDR) and (13, blue) and (13-N, orange) as analytes. Data represents the average and standard deviation of four replicates. g Affinity (KD) determined by SPR and IC50 determined by DCAF1 TR-FRET for selected DCAF1 binders. h Binding mode of (13) (orange) in DCAF1 (blue, pdb ID: 8OO5). The inlet with the cartoon depiction of DCAF1 highlights the location of the binding site in the WD40 domain of DCAF1. Shown in the remaining part is a detailed view of selected amino acids interacting with the compound. Hydrogen bonds are indicated as dashes. i Chemical proteomics describing the protein interactome of (16) in HEK293T cell lysate: Dot plot depicting competition of proteins from (16) beads by preincubation with free (16) as determined by quantitative proteomics from two independent replicates 1 and 2. Dotted line depicts cut-off at 50% competition. Source data are provided as a Source Data file.

