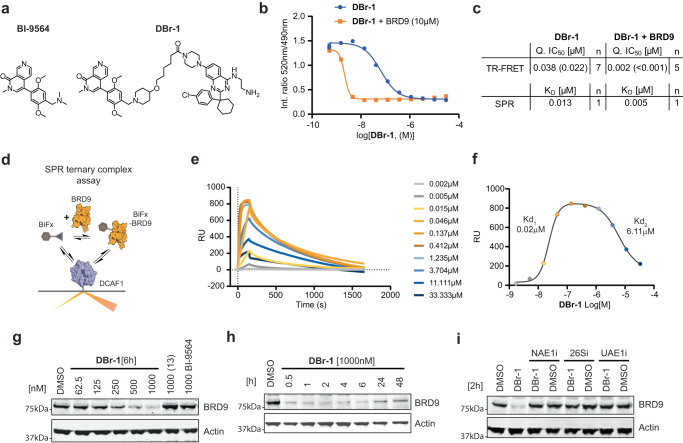
Fig. 2. DCAF1-BRD9 PROTAC characterization.
a Compound structures of BRD9 BD binder BI-9564 and corresponding DCAF1-BRD9 PROTAC (DBr-1). b TR-FRET assay binding data of DCAF1(WDR) and (DBr-1, blue) and (DBr-1 with additional 10 µM BRD9-BD(130-250), orange). c Affinity (KD) determined by SPR and IC50 determined by DCAF1 TR-FRET for DBr-1 and DBr-1 with additional 10 µM BRD9-BD(130-250). d Schematic description of SPR ternary binding assay. e SPR sensorgrams with surface immobilized DCAF1(WDR) and DBr-1 as analyte in the presence of 0.2 µM BRD9-BD(130-250). f SPR response blotted against DBr-1 concentration. (Displayed values indicate apparent KD values of the two separated sigmoidal transitions, respectively). g Immunoblot analysis of HEK293 BRD9-HiBiT/FF/CAS9 cells treated for 6 h with DBr-1 at various doses as well as (13) and BI-9564 at 1000 nM. h Immunoblot analysis of HEK293 BRD9-HiBit/FF/CAS9 cells treated with 1000 nM DBr-1 for various time points. i Immunoblot analysis of HEK293 BRD9-HiBiT/FF/CAS9 cells pretreated with NEDD8 E1 inhibitor (NAE1i) [1000 nM], proteasome inhibitor Bortezomib (26Si) [1000 nM] and Ubiquitin E1 inhibitor (UAE1i) [1000 nM] for 2 h, followed by DBr-1 treatment [1000 nM] for additional 2 h. Source data are provided as a Source Data file.

