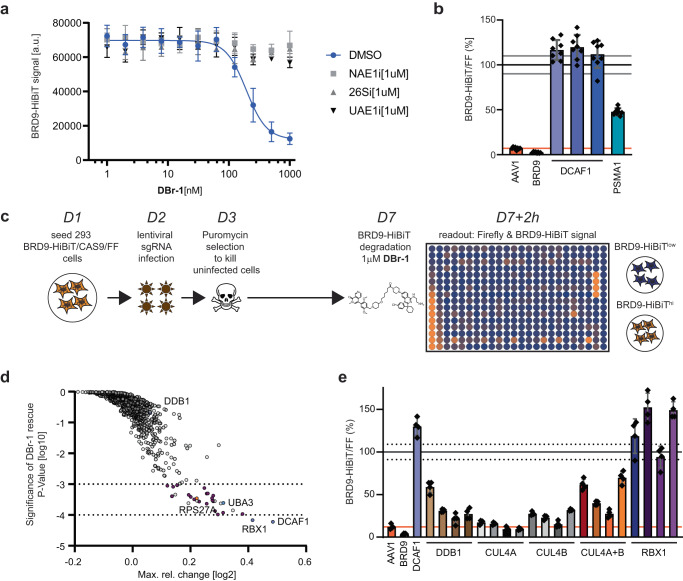
Fig. 4. Genetic characterization of the DCAF1-BRD9 PROTAC DBr-1.
a BRD9-HiBiT signal detection of samples pretreated with 1 μM of either NAE1i, 26Si, or UAE1i, followed by 2 h DBr-1 treatment at various doses, DC50 = 193 nM. Data represents mean ± SEM from n = 4 replicates. b Relative BRD9-HiBiT vs Firefly signal ratio normalized to non-treated DMSO ctrl after 2 h of DBr-1 treatment [1000 nM]. Indicated gene editing with sgRNA has been performed as described 6 days before treatment. Data represents mean ± standard deviation from n = 8 replicates. c Schematic representation and timeline for Ubiquitin-sublibrary sgRNA rescue screen for DCAF1-BRD9 PROTAC DBr-1. d Ubiquitin sgRNA sublibrary rescue scores from DBr-1 treatment plotted as significance of rescue P value (y-axis) vs. max. rel. change. Dotted lines at −4 and −3 log10 P value indicate strong and weaker hits with a false-discovery rate of 7%. For detailed description of the statistical procedure see the “Method” section. e Relative BRD9-HiBiT vs Firefly signal ratio normalized to non-treated DMSO ctrl after 2 h of DBr-1 treatment [1000 nM]. Indicated gene editing with individual sgRNAs or a combination of two guides for CUL4A and CUL4B (CUL4A + B) has been performed as described 6 days before treatment. Data represents mean ± standard deviation from n = 4 replicates. Source data are provided as a Source Data file.

