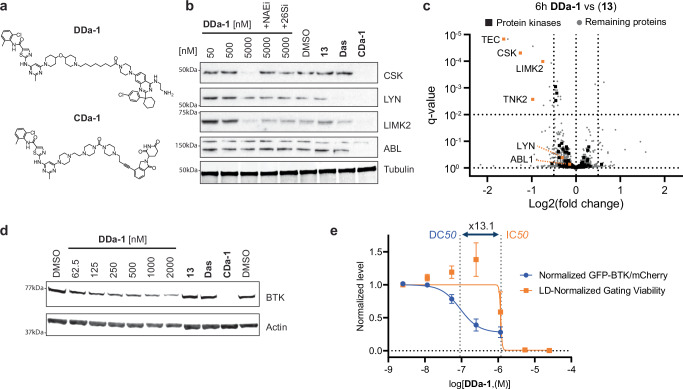
Fig. 5. DCAF1-Dasatinib PROTAC degrades multiple tyrosine kinases.
a Compound structure of the DCAF1-Dasatinib PROTAC DDa-1 and a CRBN-Dasatinib ctrl PROTAC CDa-1. b Immunoblot analysis of HEK293T cells treated for 6 h with DDa-1 at 50, 500, and 5000 nM as well as (13) and Dasatinib (Das) at a dose of 5000 nM as control. Indicated co-treatments with NEDD8 E1 inhibitor (NAE1i) [1000 nM] and proteasome inhibitor Bortezomib (26Si) [1000 nM] are indicated. CRBN-Dasatinib degrader CDa-1 [50 nM] served as an internal ctrl degrader. c Whole proteomics profile comparing differential protein levels between 5 µM DCAF1-Dasatinib PROTAC DDa-1 vs 5 µM DCAF1 binder (13) after 6 h in HEK293T cells (n = 3) plotted as log2 fold change (L2FC, x-axis) versus adjusted p value (q value, y axis). Horizontal dotted line indicates q value 10−2, vertical lines indicate a log2 fold change of 0.5. d Immunoblot analysis of TMD8 cells treated for 24 h with DDa-1 at various doses as well as (13) and Dasatinib (Das) at a dose of 2000 nM as control. CRBN-Dasatinib degrader CDa-1 [50 nM] served as an internal ctrl degrader. e Degradation of BTK-GFP in TMD8 BTK-GFP/mCh cells after 24 h DDa-1 treatment displayed as normalized rel. change of the ratio between BTK-GFP and mCherry (mCh) signals (blue curve), DC50 = 0.09 µM. Viability after 24 h DDa-1 treatment is displayed as rel. change in cellular distribution between viable and apoptotic FSC/SSC gate, GI50 = 1.20 µM. The viability window as the ratio between GI50/DC50 = 13.1 is indicated with dotted vertical lines. Data shown in the graph represents mean ± standard deviation from n = 3 replicates. Source data are provided as a Source Data file.

