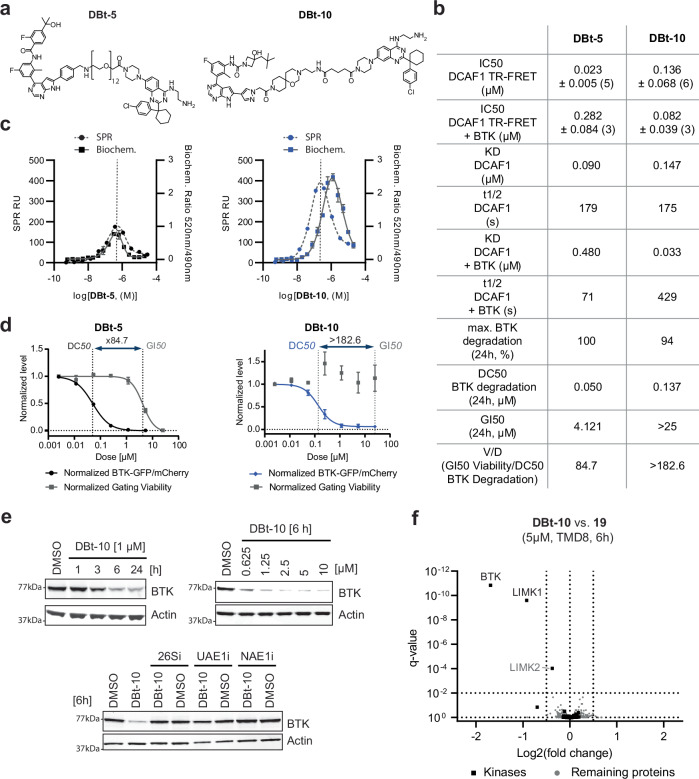
Fig. 6. Characterization and discovery of DCAF1-BTK PROTACs.
a Chemical structures of the DCAF1-BTK PROTACS DBt5 and DBt-10. b Characterization summary of various assays profiling the DCAF1-BTK PROTACs DBt5 and DBt-10. c Overlay of SPR ternary complex formation assays (dashed lines, left y-axis) with biochemical ubiquitination rates of DCAF1 measured in ubiquitin-transfer based TR-FRET assay (right y-axis, mean ± standard deviation from n = 3 replicates). d BTK degradation and cellular viability (dashed lines) assessed in BTK-GFP/mCh TMD8 cells after 24 h. The data points have been normalized to DMSO controls and each point represents the average and standard deviation of three independent experiments in triplicates. The viability window as the ratio between GI50/DC50 is indicated with dotted vertical lines. e Immunoblot analysis of TMD8 cells treated with 1 µM DBt-10 for 1, 3, 6, and 24 h time points, treated with various doses of D Bt-10 for 6 h and TMD8 cells pretreated with proteasome inhibitor Bortezomib (26Si) [1000 nM], Ubiquitin E1 inhibitor (UAE1i) [1000 nM] and NEDD8 E1 inhibitor (NAE1i) [1000 nM] for 30 min, followed by DBt-10 treatment [2500 nM] for additional 6 h. f Proteomic analysis of TMD8 cells treated (n = 3) for 6 h either with 5 µM DBt-10 or 5 µM (19). Highlighted are proteins with a log2 fold change <−0.5 and a q value < 0.01. Detected kinases are represented as squares, while all other proteins are shown as dots. Source data are provided as a Source Data file.

