Fig. 1.
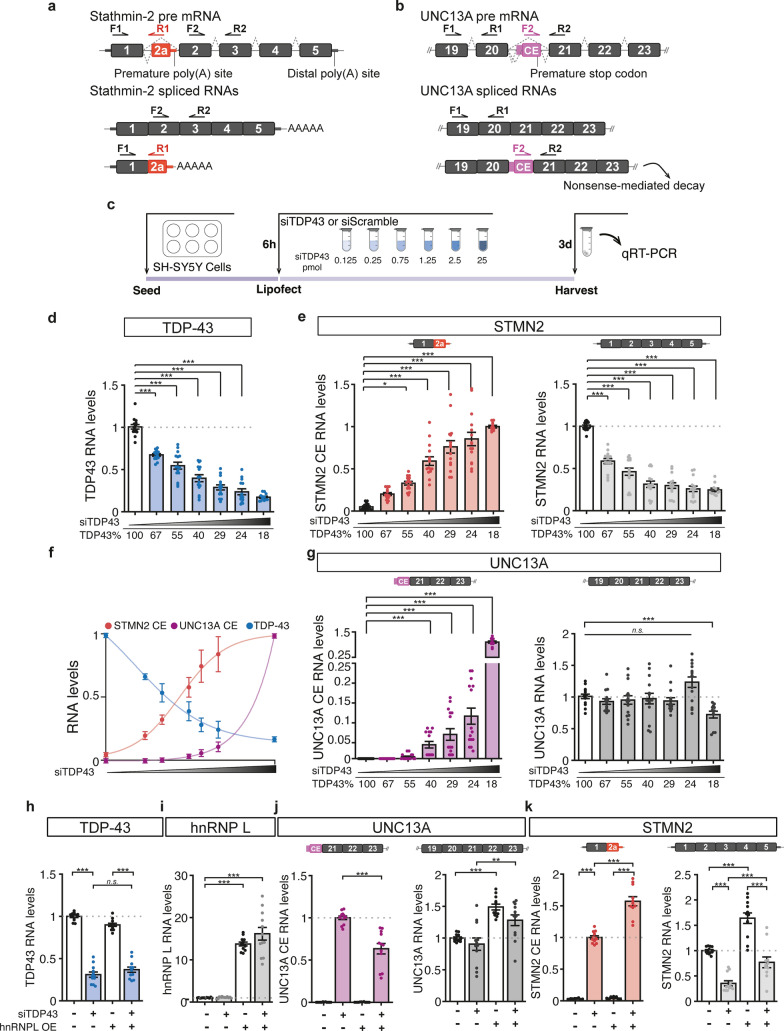
Impact of reduced TDP-43 levels on the processing of STMN2 and UNC13A mRNAs. a, b Schemes representing STMN2 (a) and UNC13A (b) constitutive exons (black) and cryptic exons (CE, red and purple, respectively) that are included upon TDP-43 loss of function. Forward (F) and reverse (R) primers’ location used to quantify the different transcripts by qRT-PCR in e–g, j, k are depicted. c Scheme of experimental design to test the sensitivity of UNC13A and STMN2 cryptic exons to TDP-43 knockdown in neuroblastoma (SH-SY5Y) cells treated with increasing amounts of siRNA against TDP-43 (siTDP43) for 3 days. d–g qRT-PCR quantification of the RNA levels of TDP-43 (d, blue), STMN2 transcripts with cryptic exon (e, red), STMN2 full-length (e, light gray), UNC13A transcripts with cryptic exon (g, purple) and UNC13A full-length (g, dark gray). As control, cells were treated with a scramble siRNA. f Levels of TDP-43 (blue), STMN2 cryptic exon (red) and UNC13A cryptic exon (purple) in response to TDP-43 knockdown. Data were fitted using a non-linear curve-fit in Prism, and the x axis is plotted with a log10 scale. h–k SH-SY5Y cells genetically modified to overexpress hnRNP L or a GFP control and treated with siRNA against TDP-43 for 3 days (2.5 pmol). qRT-PCR was used to determine the expression levels of TDP-43 (blue, h), hnRNP L (i, gray), UNC13A transcripts with (j, purple) and without cryptic exon (j, dark gray) and STMN2 transcripts with (k, red) and without cryptic exon (k, light gray). d–k RNA levels were normalized to GAPDH and to the control group. Levels of full-length RNAs were normalized to cells treated with the control siRNA and transcripts with cryptic exons were normalized to cells treated with highest dose of TDP-43 siRNA. Results from 4 to 5 independent experiments were plotted with each dot representing a technical replicate and bars representing mean ± SEM. Normal distribution of data was tested using D’Agostino & Pearson test and one-way ANOVA, followed by Holm-Šídák’s Multiple comparisons post-hoc test (parametric) or Kruskal–Wallis, followed by a Dunn’s Multiple comparisons post-hoc test (non-parametric) were performed accordingly

