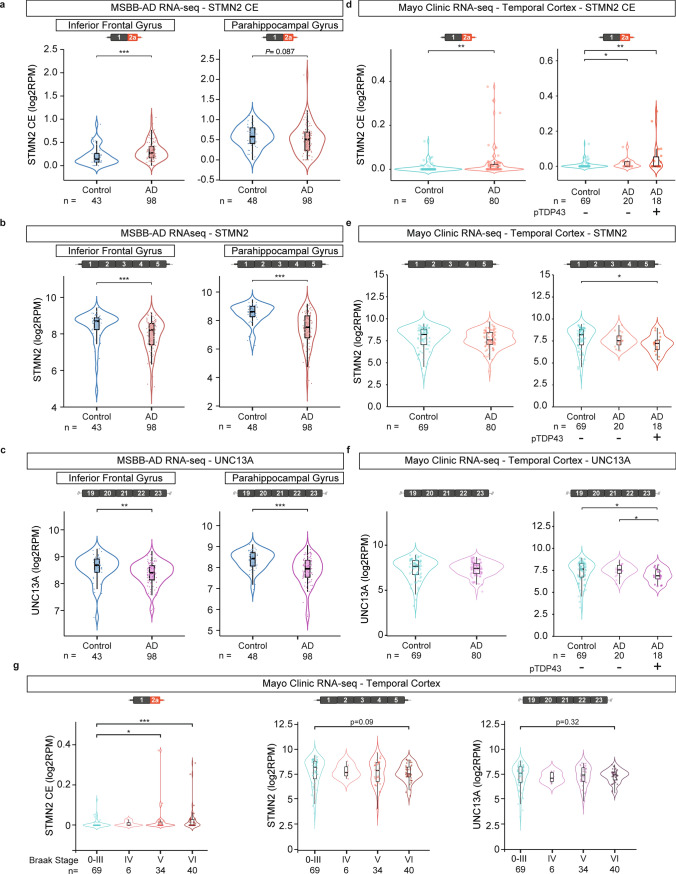
Fig. 4.
Analysis of STMN2 and UNC13A mRNAs in RNA-seq datasets from Alzheimer’s disease post-mortem tissues. Expression of STMN2 and UNC13A was analyzed using published RNA-seq datasets from the Mount Sinai/JJ Peters VA Medical Center Brain Bank (MSBB-AD) [97] (a–c) and from the Mayo Clinic Brain Bank [2, 3, 98] (d–g). Levels of STMN2 cryptic exon (red, a, d), STMN2 full-length transcript (red, b, e) and UNC13A full-length transcript expression (purple, c, f) were determined in the parahippocampal and inferior frontal gyri (a–c) or temporal cortex (d–g) of Alzheimer’s disease patients compared to controls. g Levels of STMN2 cryptic exon (left, red), STMN2 full-length (middle, red) and UNC13A full-length (right, purple) in post-mortem brain tissue from controls (Braak stage 0–III) and Alzheimer’s disease patients segregated according to their Braak stage (Braak stages IV–VI)

