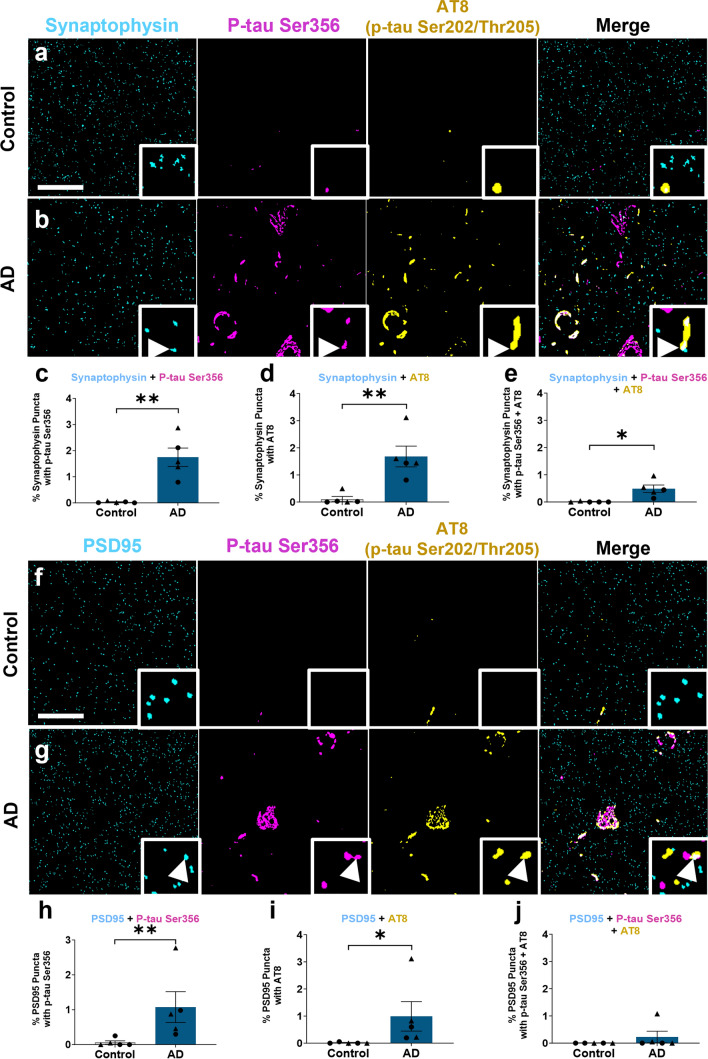
Fig. 3.
p-tau Ser356 co-localises at the synapse in Alzheimer’s disease post-mortem brain. a, b, f, g Representative segmented images of 70 nm thick array tomography sections from control (a, f) or AD (b, g) post-mortem brain. Sections were stained with the pre-synaptic marker synaptophysin (cyan a, b), the postsynaptic marker PSD95 (cyan f, g), p-tau Ser356 (magenta) and AT8 (yellow). Arrows indicate the area of co-localisation of synaptic markers, p-tau Ser356 and AT8 in AD brain. There is a significant increase in synaptophysin co-localising with p-tau Ser356 (**F(1,7.14) = 18.7, p = 0.0033) (c), synaptophysin co-localising with AT8 (**F(1,7.13) = 14.6, p = 0.0063) (d), and synaptophysin containing both p-tau Ser356 and AT8 (*F(1,7.08) = 10.5, p = 0.014) (e) in AD brain. There is a significant increase in PSD-95 co-localising with p-tau Ser356 (**F(1,7.38) = 12.50, p = 0.0088) (h) and PSD-95 co-localising with AT8 in AD brain (**F(1,7.14) = 9.08, p = 0.019) (i), but no significant difference in post-synapses containing both p-tau Ser356 and AT8 (F(1,7.27) = 1.28, p = 0.294) between control and AD (j). Each point on the graph represents the median from a single case, males = triangles, females = circles. N = 5 control and 5 AD cases. Scale bar represents 20 µm, square insets represent 5 µm × 5 µm

