FIGURE 10.
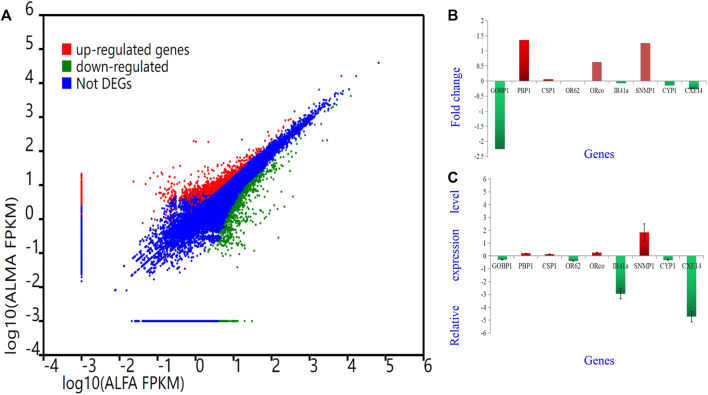
Different Gene expression analysis. Unigenes between proboscis of male adults and female adults of A. lepigone comparisons. (A) Up-regulated (red) and down-regulated (green) unigenes were quantified using the tag-based digital gene expression (IDEG6) tool. (B) The fold changes of selected eight unigenes from transcriptome sequence analysis between male and female adults’ comparison. (C) The relative expression levels of selected eight unigenes by qRT-PCR in AMA compared with AFA.

