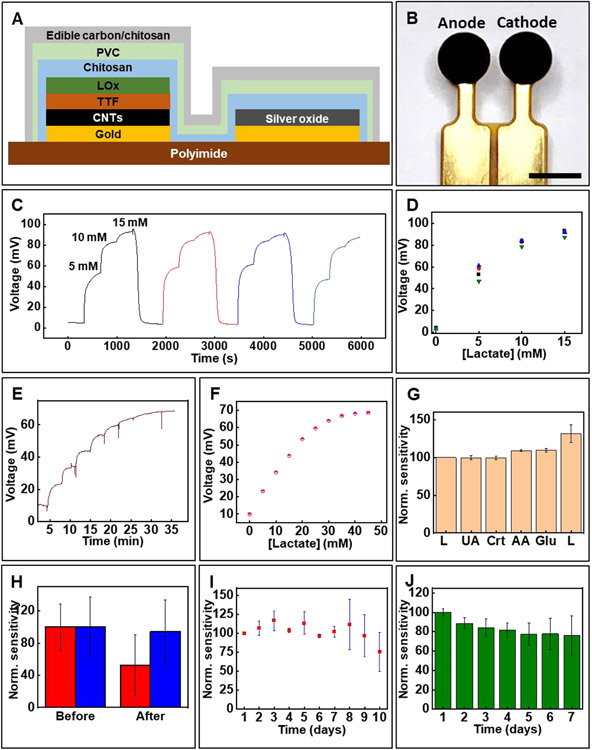
Figure 2.
Key components of biofuel cell-based lactate sensor and its in vitro characterization. (A) Schematic representation showing the key components of the lactate sensor. (B) Image of the lactate sensor. Scale bar 2 mm. (C, D) Reversibility of the lactate sensor signal. (E) Real-time response of the lactate sensor to increasing concentrations and (F) the corresponding calibration plot. (G) Effect of common interfering biochemicals on sensor response. (H) Effect of the UV protective coating on sensor response before and after UV sterilization. Red: without UV protective membrane; Blue: with UV protective membrane (I) Sensor stability studied over a period of 10 days at ambient conditions. (J) Effect of biofouling using artificial wound fluid studied over 7 days. (G-J) Data presented as mean ± S.D., n=3.

