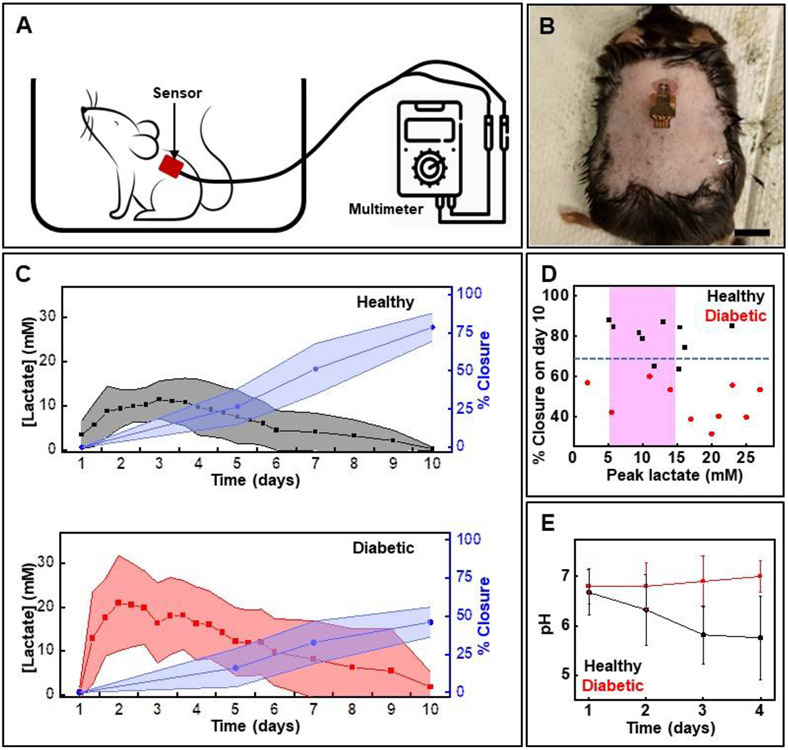
Figure 4.
In vivo studies of the lactate sensor using a mouse model of full thickness dermal wound. (A) Scheme showing the setup for acquiring data using wired sensors (B) Photo of a mouse with the sensor attached onto the wound. Scale bar: 1 cm. (C) Measured lactate levels and % wound closure in healthy and diabetic mice by time (data presented as mean ± S.D., n=10 for each cohort). (D) Relationship between % wound closure on day 10 and lactate level on day 3 of wounding. The pink region shows normal wound lactate range. The blue dotted horizontal line separates wounds that heal normally (wound closure rate > 70% by day 10) from those that show impaired healing (wound closure rate < 70% by day 10). (E) pH levels measured in wounds in healthy and diabetic mice over a period of 4 days (data presented as mean ± S.D, n=6 for each cohort).

