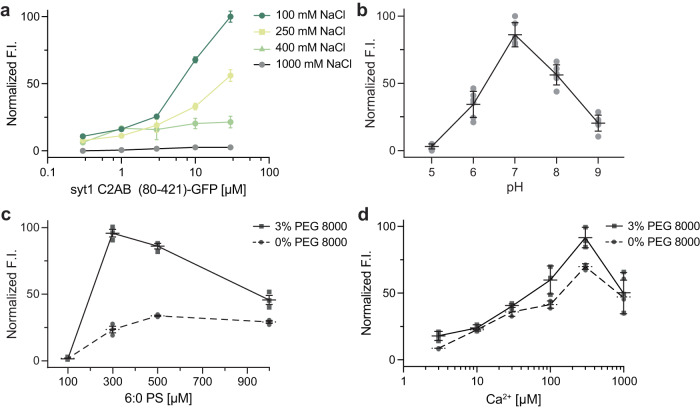
Fig. 5. Examination of droplet formation and dissolution of syt1 C2AB (80–142)-GFP as a function of ionic strength, pH, soluble [6:0 PS], and [Ca2+].
a Normalized fluorescence intensity (F.I.) of droplets were analyzed as a function of increasing salt and protein concentration (3% PEG 8000). b Same as a, but as a function of pH; n = 3 fields of view and error bars represent SEM. The buffers for different pH solutions (described in Methods) also contained 100 mM NaCl and 3% PEG 8000. c Same as a, but as a function of [6:0 PS] in 25 mM Tris-HCl (pH 7.4), 100 mM NaCl, with and without 3% PEG 8000; n = 3 fields of view and error bars represent SEM. d Same as c, but as a function of [Ca2+] buffered with EGTA, with and without 3% PEG 8000. Source data are provided as a Source Data file.

