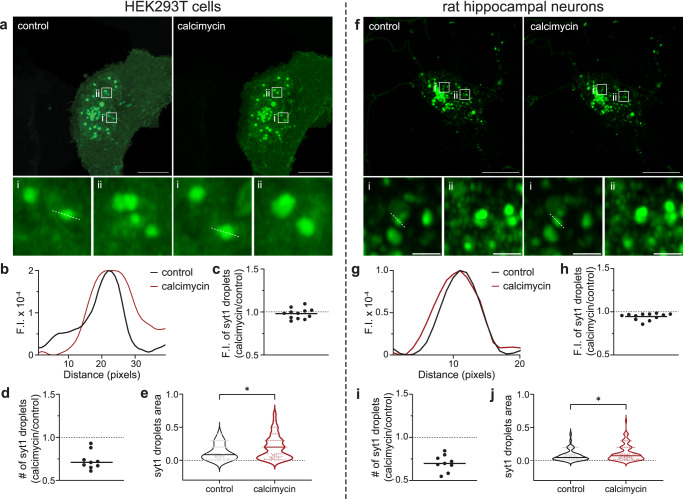
Fig. 7. Ca2+ influx, via an ionophore, drives syt1 droplet fusion in HEK293T cells and cultured rat hippocampal neurons.
Left: HEK293T cells; Right: cultured rat hippocampal neurons. a, f Representative images of HEK293T cells/hippocampal neurons overexpressing syt1 C2AB (80–421)-GFP showing protein droplets under control and +calcimycin (a Ca2+ ionophore) conditions. Two inset images, shown at higher magnification, reveal the larger droplet size in the +calcimycin condition; n = 3. b, g Representative line scan traces of dashed lines in a (i) and f (i) measuring fluorescence intensity of syt1 droplets under control and +calcimycin conditions. c–e, h–j Plots of syt1 droplet fluorescence intensity (F.I.), number, and area. Calcimycin treatment had no effect on F.I. but decreased the number of droplets and increased their area (Ratio of number of syt1 droplets under calcimycin vs control conditions: 0.73 ± 0.1 SD (HEK293T), 0.70 ± 0.1 SD (neurons)). A total of nine fields of view were analyzed, and droplet area was measured as described in Methods. Mean values are indicated by the horizontal line in each panel. In panels e and j, the p-values of 0.016 (HEK293T), 0.042 (neurons) were calculated using the Mann–Whitney two-sided test. Source data are provided as a Source Data file. Scale bars, 10 µm. Inset scale bars, 1 µm.

