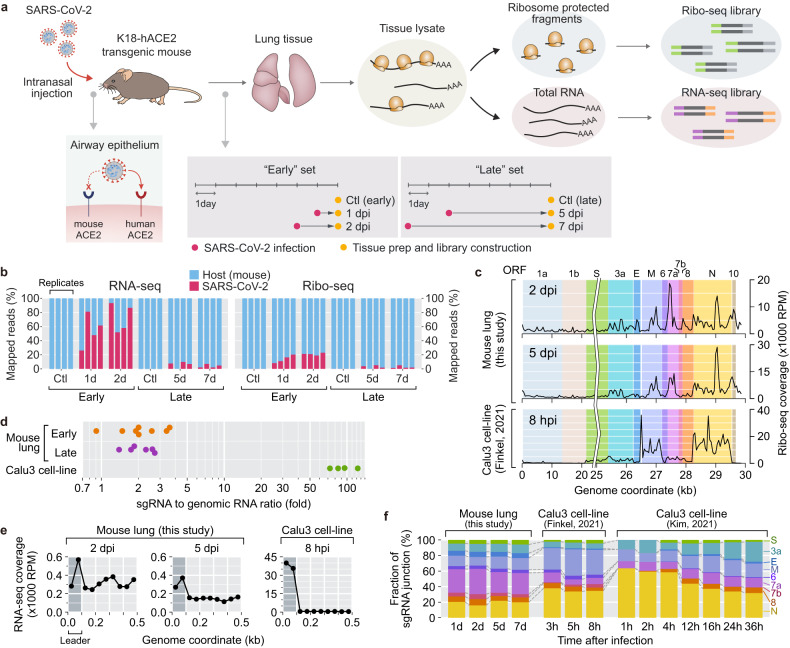
Fig. 1. Transcriptome and translatome landscapes of SARS-CoV-2 in tissue microenvironments.
a Experimental workflow. Ribo-seq and RNA-seq libraries were prepared using lung tissue lysates from K18-hACE2 transgenic mice infected with SARS-CoV-2. b The percentages of the RNA-seq and Ribo-seq reads that were mapped to the viral (red) or host (blue) genomes. Each bar represents an individual library of one replicate per condition. c Density maps of the Ribo-seq reads across the SARS-CoV-2 genome. d Ratios of sgRNAs to gRNA estimated by the proportions of TRS-L spanning reads in the RNA-seq datasets of mouse tissues and human cell lines. e Read coverages of the mouse tissue and human cell line RNA-seq libraries around the 5′ end of the SARS-CoV-2 genome. The 5′ leader sequence is dark gray. f Temporal profiles of individual SARS-CoV-2 sgRNA levels in mouse tissues and human cell lines.

