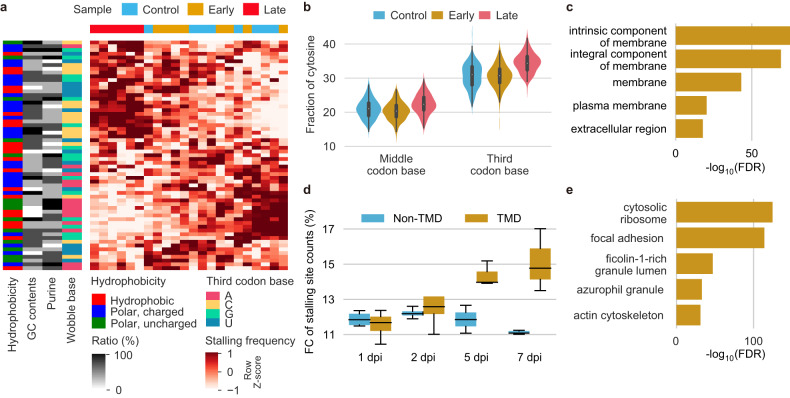
Fig. 5. Ribosomes stall preferentially on codons of transmembrane protein-coding mRNAs in the late phase.
a Heatmap showing the collective intensities of ribosomes stalling on individual amino acid codons. The codon sites with the top 10,000 Z scores of RPF A-site enrichment are included in the intensity calculation. The white‒red color key represents a spectrum from the lowest stalling site count (white) to the highest stalling site count (red). Hierarchical clustering based on the Canberra distance between codons (row) or samples (column) was performed (dendrograms not shown). The sidebars show the hydrophobicity group, GC content, purine ratio, and wobble base of each codon. The top color bar indicates the samples. b Violin plots representing relative fractions of cytosine in the middle (left) and third base positions (right) of the codons with the top 10,000 Z scores. See also Supplementary Fig. 5b. c A bar plot showing GO terms that are overrepresented by genes in which the C frequency in the third base position is high. The bar lengths represent FDR values based on Cohen’s d effect sizes of the associations between the ratios of third base C residues and GO terms. The top five GO terms with the lowest FDRs are shown. d Box plot depicting the RPF FC at stalling sites within the transmembrane domain (TMD)- and non-TMD-coding regions throughout the postinfection time course. e Gene Ontology (GO) term enrichment analysis using EnrichR revealed the top 1000 genes harboring the strongest intensities of ribosome stalling at 5 and 7 dpi. The top 10 GO terms of cellular components that were significantly enriched (adjusted P value < 0.05) are presented.

