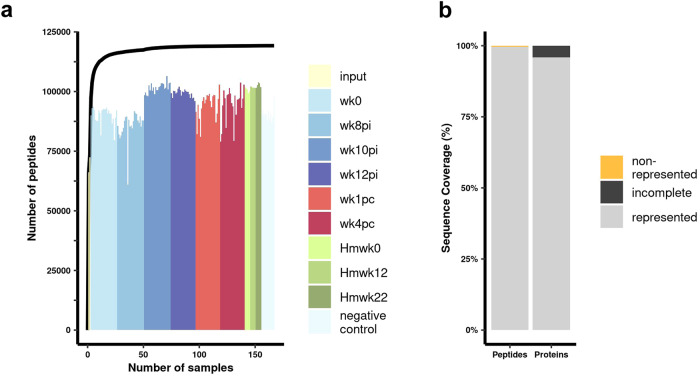
Fig. 2. PhIP-Seq provides exceptional coverage of the S. mansoni proteome.
a The histogram illustrates the number of different peptides detected in 167 sequenced samples from a phage-display library encoding 119,747 unique peptides. The samples include two input libraries (input), 138 PhIP-Seq duplicate samples obtained with 12 rhesus macaques’ plasma collected at six different time points, namely before infection (wk0), three time points post-infection (pi) (wk8pi, wk10pi, and wk12pi), as well as at two time points post-challenge (pc) (wk1pc and wk4pc); also, 15 PhIP-Seq samples were obtained at three time points, with five hamsters’ (Hm) sera each, collected at Hmwk0, Hmwk12, and Hmwk22, and 12 PhIP-Seq samples of negative controls (magnetic beads only, no plasma/serum). Different colors represent input libraries (yellow), the six different weeks at which the PhIP-Seq data were collected with rhesus macaques’ plasma (shades of blue and red), or the three PhIP-Seq datasets with hamster serum samples (shades of green), and PhIP-Seq negative controls (light blue; refer to the color legend on the right). The black line graph depicts the cumulative number of different peptides detected when combining sequencing data from the multiple samples. For the line graph, the X-axis represents the number of combined samples, while the Y-axis represents the number of different peptides detected. b The bar graph provides an overview of the library coverage based on the sequenced data from all samples, focusing on the representation of peptides (left bar) and proteins (right bar). The Y-axis shows the percentage of represented (gray) or non-represented (orange) peptides (left bar), and the percentage of fully represented (gray) or incomplete (black) proteins (right bar) (see legend on the right side of the graph).

