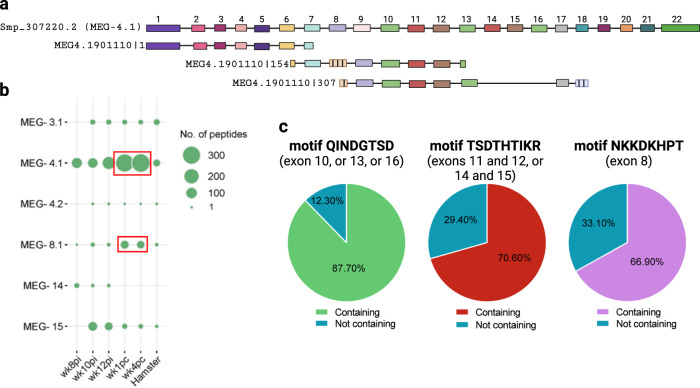
Fig. 5. Enrichment of multiple MEG peptides originated from putative in silico designed alternatively spliced MEG isoforms.
a Example of an in silico designed alternatively spliced variant of MEG-4.1. The upper sequence represents the canonical exons structure of Smp_307220.2 (MEG-4.1). Below, three in silico-designed 174-nt long oligo sequences are shown, which encode a putative splice variant, namely MEG4.1901110. The number following the pipe symbol (|) indicates the start position of the oligonucleotide segment encoding each peptide. Filled colored boxes represent exons in the canonical isoform, while hatched boxes represent non-canonical new exons. Exons are shown to scale, but intron lengths are not proportional for illustrative purposes. Numbers above exons indicate their position in the canonical sequence. Note the seven aa (21-nt) overlap between the first two consecutive oligo sequences (MEG4.1901110 | 1 and MEG4.1901110|154). The third, last sequence (MEG4.1901110|307) extends by a few amino acids the in silico predicted shorter MEG4.1 protein isoform, therefore having a longer overlap with the second oligo. b Number of enriched peptides per MEG family gene that were captured by rhesus macaques’ plasma samples collected at different weeks post-infection (wk8pi, wk10pi, wk12pi) or at weeks post-challenge (wk1pc, wk4pc), as well as the overall number of enriched peptides captured by infected hamster serum samples (Hamster). Circle size represents the number of peptides (legend on the right). Red boxes highlight the increase in MEG-4.1 and MEG-8.1 peptides captured by rhesus macaques’ plasma after challenge. c Pie charts illustrate the percentage of enriched peptides containing three different highly frequent motifs among all MEG-4.1 sequences captured with rhesus macaques’ plasma or not containing (legends at the bottom of each pie chart). Each motif sequence and the respective exon position within the Smp_307220.2 sequence is shown at the top of each pie chart.

