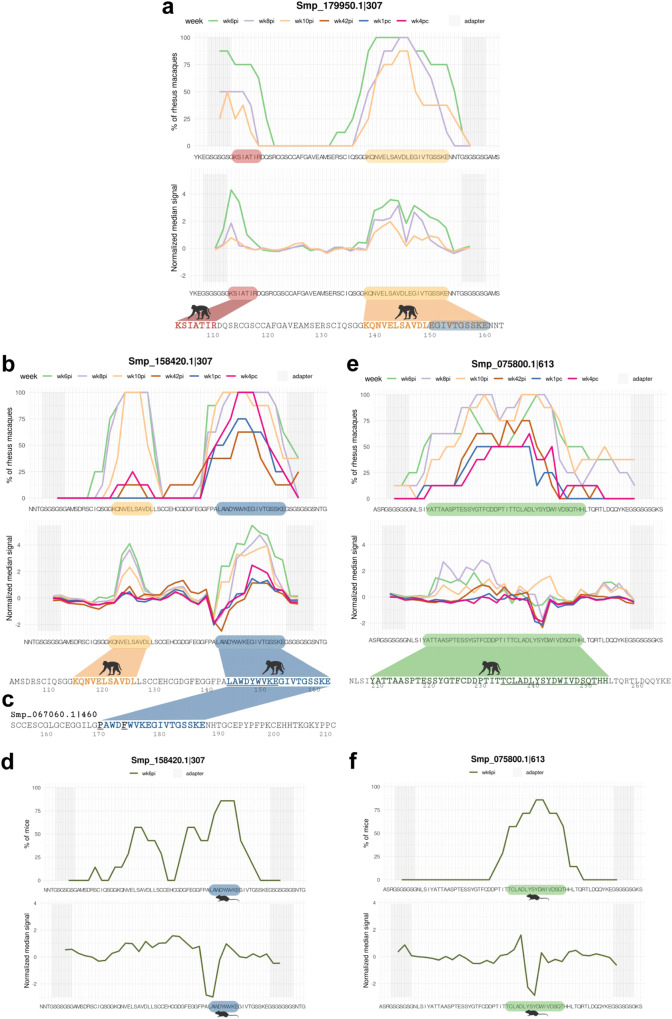
Fig. 7. S. mansoni SmCatB paralogs (Smp_179950.1 and Smp_158420.1) and SmAE Asparaginyl endopeptidase (Smp_075800.1) epitope mapping with reactive plasma from rhesus macaques.
a, b, and e For each 58-mer phage-peptide indicated at the top of each panel, its peptide sequence is shown at the bottom of each chart; microarray adapter stretches at both ends of the sequence are highlighted with a grey background. The upper chart represents the percentage of animals (out of 8 rhesus macaques) exhibiting antibody reactivity against epitopes from that peptide, and each line color represents a different week post-infection (wk6pi, wk8pi, wk10pi, wk42pi) or post-challenge (wk1pc and wk4pc) (legends on top of upper charts). The lower chart represents the median normalized signal intensities at each week post-infection/challenge. The colored blocks at the lowermost sequence in each panel highlight the epitopes recognized by at least 50% of rhesus macaques (out of 8 animals); part of the motif that is underlined is in common with the motif recognized by sera from infected mice (see below). c Another PhIP-Seq enriched SmCatB paralog, namely peptide Smp_067060.1|460, which was not screened in the peptide array, is shown here for comparison with Smp_158420.1|307 sequence. Common epitopes between the two different SmCatB sequences are marked in blue, and the two different amino acid residues between both motifs are shown in (c) in black font and underlined. d, f Upper charts showing the fraction of mice (out of 7 animals) exhibiting week 6 post-infection (wk6pi) serum reactivity against an epitope from that peptide sequence. Lower charts represent the median normalized signal intensities. Images created with Biorender.com.

