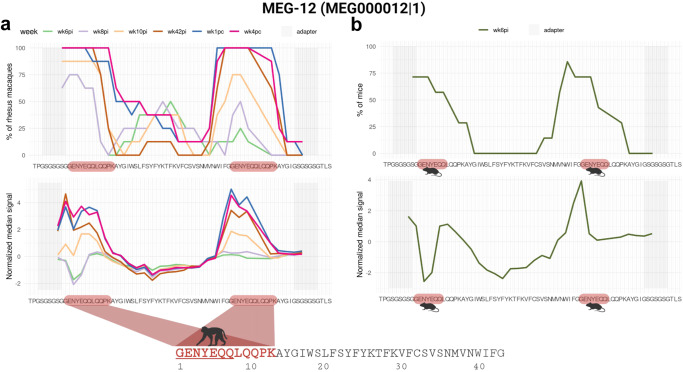
Fig. 9. S. mansoni MEG-12 epitope mapping with reactive plasma from rhesus macaques.
a The MEG-12 58-mer phage-peptide sequence is shown at the bottom of each chart; microarray adapter stretches at both ends are highlighted with a grey background. Note that the 16-aa N-terminal sequence of MEG-12 is duplicated at the end of the 42-aa original sequence in this phage-display peptide construct. The upper chart represents the percentage of rhesus macaques (out of 8 animals) exhibiting antibody reactivity against an epitope from that peptide, and each line color represents a different week post-infection (wk6pi, wk8pi, wk10pi, wk42pi) or post-challenge (wk1pc and wk4pc) (legends on top of upper charts). The lower chart represents the median normalized signal intensities at each week post-infection/challenge. The colored block at the lowermost sequence highlights the epitope recognized by at least 50% of rhesus macaques (out of 8 animals); part of the underlined motif is in common with the motif recognized by sera from infected mice (see below). b Upper chart shows the fraction of mice (out of 7 animals) exhibiting week 6 post-infection (wk6pi) serum reactivity against an epitope from the MEG-12 peptide sequence. The lower chart represents the median normalized signal intensities. Images created with Biorender.com.

