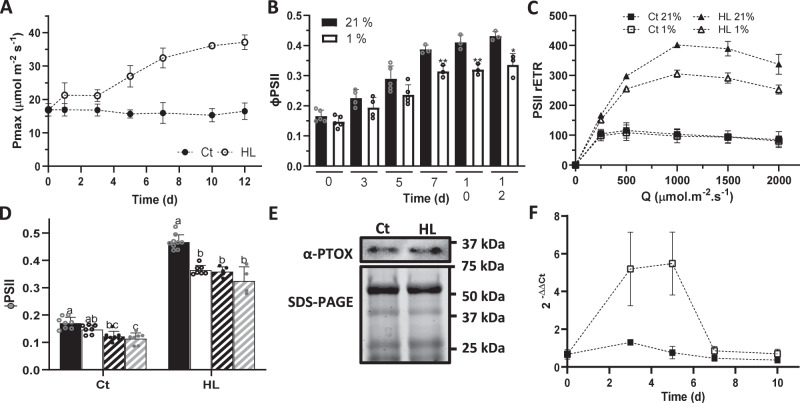
Fig. 1. PTOX activity is triggered by high light in Eutrema salsugineum.
A Maximum photosynthetic capacity (Pmax) of Eutrema plants subjected to control (Ct) or high light (HL) treatment (n = at least 3). B Quantum yield of PSII (ΦPSII) measured at 21% or 1% O2 (black and white bars, respectively) during HL acclimation (n = at least 3). The asterisk indicates differences between measurements at 21 and 1 % O2 (Student’s t test, *p < 0.05; **p < 0.01, two-sided). C Relative electron transport rate of PSII (PSII rETR) at 21% or 1% O2 (filled and empty symbols, respectively), in 10 d Ct or HL-treated plants (n = 3). D Measurements of ΦPSII in vacuum-infiltrated Eutrema leaves of 10 d Ct or HL-treated plants. Black bars, H2O infiltration and 21% O2; white bars, H2O infiltration and 1% O2; black stripped bars, 1 mM nPG and 21% O2; gray stripped bars, 1 mM nPG and 1% O2 (n = at least 4). Different letters above the error bars indicate statistically different values (ANOVA, Tukey’s test, p < 0.05). E PTOX protein content in 10 d Ct and HL-treated plants (protein loaded = 100 μg). Immunoblots were repeated twice, independently, obtaining the same results. F Transcript Expression analysis of PTOX in Ct and HL-treated plants (filled and empty symbols, respectively). Gene quantification was determined based on the expression of the PTOX gene relative to the housekeeping gene GADPH (n = at least 3). Data are the mean ± SD of independent biological replicates. All raw data, with number of replicates per data point, are provided in the source data file. Measurements conditions of A, B and D were 2000 ppm CO2 and 1000 μmol.m−2.s−1 light. C was measured at 2000 ppm CO2 and different light intensities.

