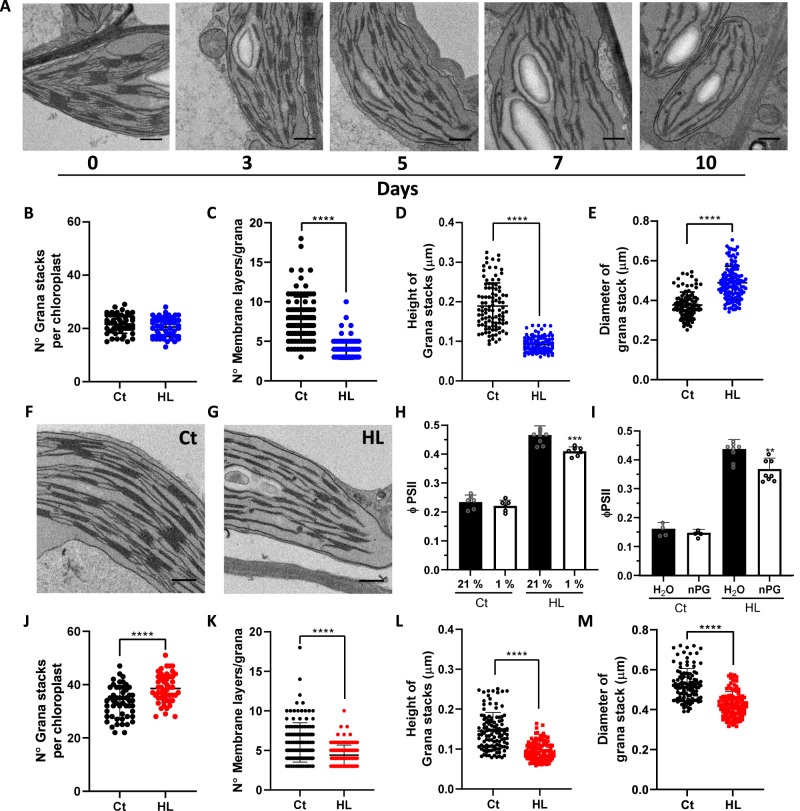
Fig. 3. Chloroplast structural re-organization is associated with PTOX activation.
A Microgaphs of Eutrema leaves exposed to different days of high light (HL) treatment. B–E Chloroplast ultrastructure parameters calculated at 0 (Ct) and 10 d of HL in Eutrema. F, G Micrographs of Arabidopsis leaves exposed to Ct or HL, respectively, for 12 d. H ΦPSII measured at 21% or 1% O2, in Arabidopsis plants exposed to 12 d Ct or HL conditions. I ΦPSII was measured in vacuum-infiltrated leaves of 12 d Ct or HL-treated Arabidopsis plants. Infiltration was performed with water or 1 mM nPG. H and I. were measured at 1000 μmol m−2 s−1 light and 2000 ppm CO2 J–M Chloroplast ultrastructure parameters calculated for Ct and HL Arabidopsis. Data are the mean ± SD of at least n = 50 chloroplasts (B, J) or n = at least 100 grana stacks (C–E, K–M), and at least 4 biological replicates for H and I. A minimum of 25 non-overlapping fields of view of the ultra-thin sections were examined, and leaf pieces of two plants were fixed for the analysis. The asterisk indicates differences between Ct and HL treatments for B–E and J–M (Welch’s test, ****p < 0.0001, two-sided) and differences between 21% and 1% O2, or H2O and nPG for H and I, respectively (Student’s t test, **p < 0.01, ***p < 0.001, two-sided). All raw data, with number of replicates per data point, are provided in the source data file. Scale bars = 0.5 μm.

