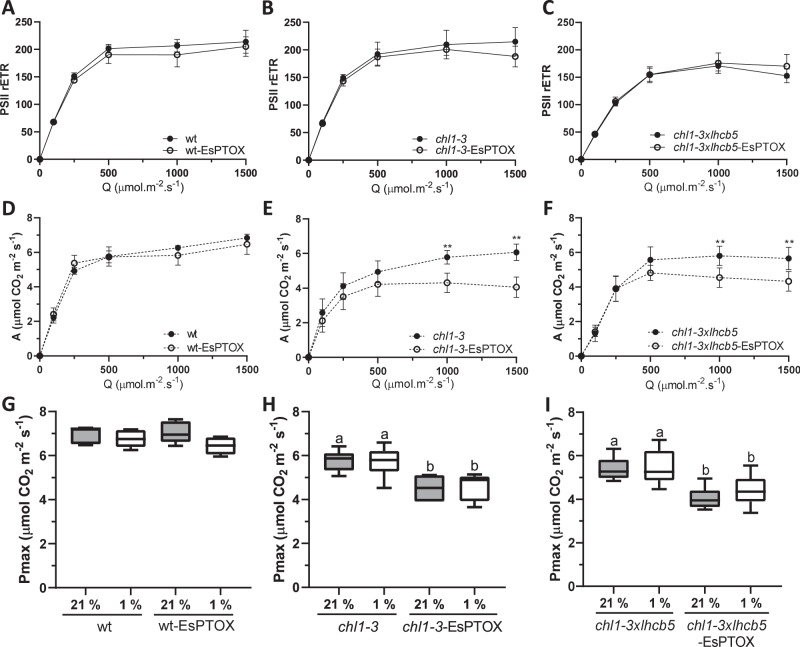
Fig. 5. The effect of EsPTOX expression on photosynthetic assimilation rates at saturating CO2 conditions in the Arabidopsis thylakoid stacking mutants.
Relative electron transport rate of PSII (PSII rETR) and assimilation (A, μmol CO2.m−2.s−1) of wt and wt-EsPTOX (A, D), chl1-3 and chl1-3-EsPTOX (B, E), and chl1-3xlhcb5 and chl1-3xlhcb5-EsPTOX (C, F). Measurements were performed at 2000 ppm CO2 (n = at least 4). The asterisk indicates differences between lines expressing EsPTOX or not, at a certain light intensity (Student’s t test, p < 0.01, two-sided). The maximum capacity for photosynthesis (Pmax) measured under 21% and 1% O2, and irradiance 1000 µmol.m−2.s−1, in the wt and wt-EsPTOX genotypes (G), chl1-3 and chl1-3-EsPTOX (H) and chl1-3xlhcb5 and chl1-3xlhcb5-EsPTOX (I) (n = at least 4). Data are the mean ± SD of independent biological replicates. Box plots represents the median, lower and upper quartile, while the whiskers the smallest and largest value. Different letters above the error bars indicate statistically different values (ANOVA, Tukey’s test, p < 0.05). All raw data, with number of replicates per data point, are provided in the source data file.

