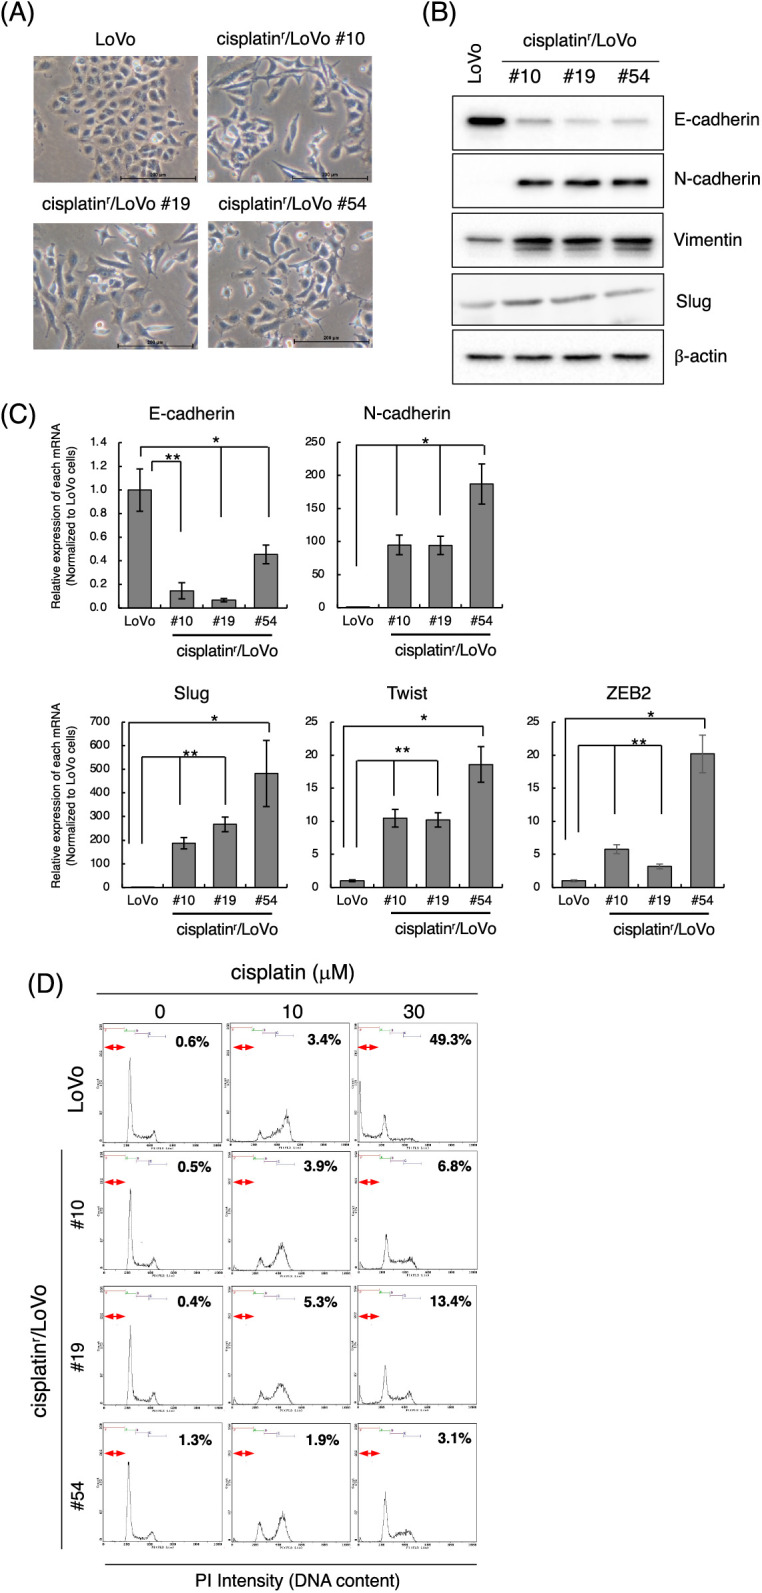
Figure 1. Establishment of cisplatinr/LoVo cells having mesenchymal-like features. (A) Morphologies of LoVo cells and cisplatinr/LoVo #10, #19, and #54 cells were observed under a phase-contrast microscope. Images are representative of two independent experiments. Scale bar, 200 μm. (B) LoVo and cisplatinr/LoVo cells were lysed, and the expression of E-cadherin, N-cadherin, Vimentin, Slug, and β-actin was detected by western blotting. Images are representative of two independent experiments. (C) Measurement of E-cadherin, N-cadherin, Slug, Twist, and ZEB2 mRNAs levels. Total RNA was extracted from exponentially growing LoVo and cisplatinr/LoVo #10, #19, and #54 cells. Then, the amount of E-cadherin, N-cadherin, and Slug, Twist, and ZEB2 mRNAs was evaluated with qPCR. The presented data are normalized to LoVo cells. All data are representative of three independent experiments and presented as mean SD ± (n = 3). *p < 0.05, **p < 0.01 (two-tailed Student’s test). (D) Cisplatinr/LoVo cells were resistant to cisplatin-induced apoptosis. LoVo cells and each cisplatinr/LoVo cells were treated with 10 or 30 μM of cisplatin for 48 h. Cells were fixed with 70% ethanol, stained with PI, and analyzed using flow cytometry. Percentages of the subG1 population (areas between red line) in cells treated with 30 μM cisplatin are shown. Moreover, percentages of the subG1, G1, S, and G2/M phase populations are summarized in Table 2. Images are representative of two independent experiments.

