. 2023 Nov 15;32(1):139–150. doi: 10.32604/or.2023.030190

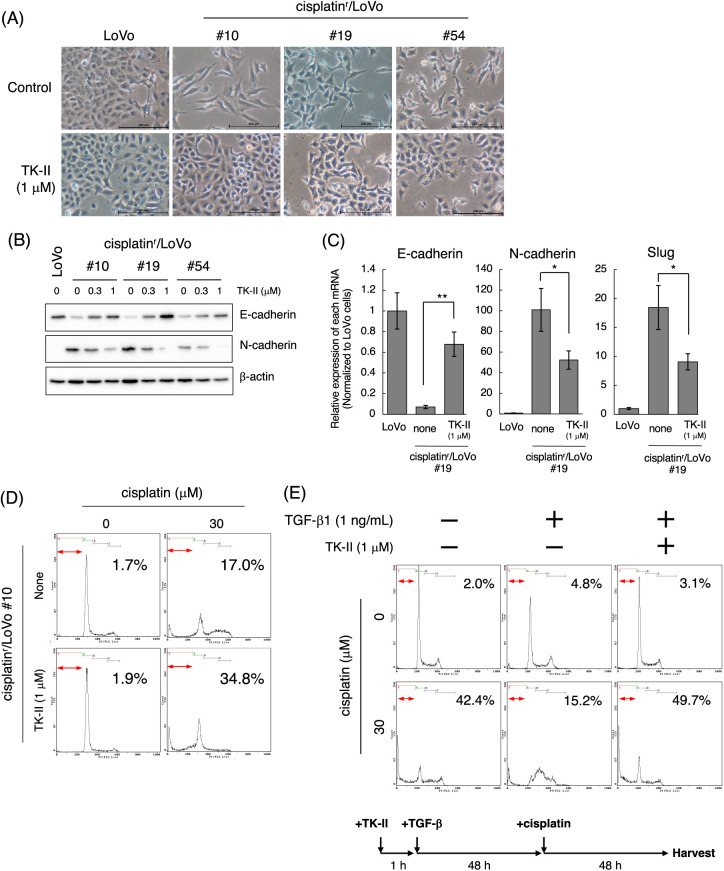
Figure 2. TβRI kinase inhibitors partially reverse the mesenchymal-like phenotype of cisplatinr/LoVo cells to epithelial-like phenotype. (A) Morphological changes of LoVo and cisplatinr/LoVo cells after TK-II treatment. LoVo or cisplatinr/LoVo cells (#10, #19, and #54) were treated with 1 μM TK-II for 72 h, and their morphologies were observed under a phase-contrast microscope. Images are representative of two independent experiments. Scale bar, 200 μm. (B) The effect of TK-II on E-cadherin and N-cadherin expression in cisplatinr/LoVo cells. Cisplatinr/LoVo cells were treated with 0.3 or 1 μM TK-II for 72 h. Expression of E-cadherin and N-cadherin was evaluated by western blotting. Images are representative of two independent experiments. (C) The effect of TK-II on the expression of E-cadherin, N-cadherin, and Slug mRNAs in cisplatinr/LoVo #19 cells. Cisplatinr/LoVo #19 cells were treated with 1 μM TK-II for 72 h. Then, the amount of E-cadherin, N-cadherin, and Slug mRNAs were evaluated with qPCR. The presented data are normalized to LoVo cells. All data are representative of three independent experiments and presented as mean SD ± (n = 3). *p < 0.05, **p < 0.01 (two-tailed Student’s test). (D) Effect of TK-II on cisplatin-induced apoptosis of cisplatinr/LoVo cells. Cisplatinr/LoVo#10 cells were pre-treated with 1 μM TK-II for 72 h and then were treated with 30 μM cisplatin for 48 h. Cells were fixed with 70% ethanol, stained with PI, and analyzed using flow cytometry. Percentages of the subG1 population (areas between red line) in cells are shown. Images are representative of two independent experiments. (E) TGF-β1-pre-treated LoVo cells are resistance to cisplatin-induced apoptosis. TK-II was pre-treated 1 h before the treatment of cells with 1 ng/mL TGF-β1 for 48 h. Then, the cells were further treated with 0 or 30 μM cisplatin for 48 h. Then, the cells were harvested and fixed with 70% ethanol, stained with PI, and analyzed using flow cytometry. The number indicates the subG1 population (areas between red line). Images are representative of two independent experiments. The schematic illustration shows a diagram of the treatment protocol.

Figure 2