. 2023 Nov 15;32(1):139–150. doi: 10.32604/or.2023.030190

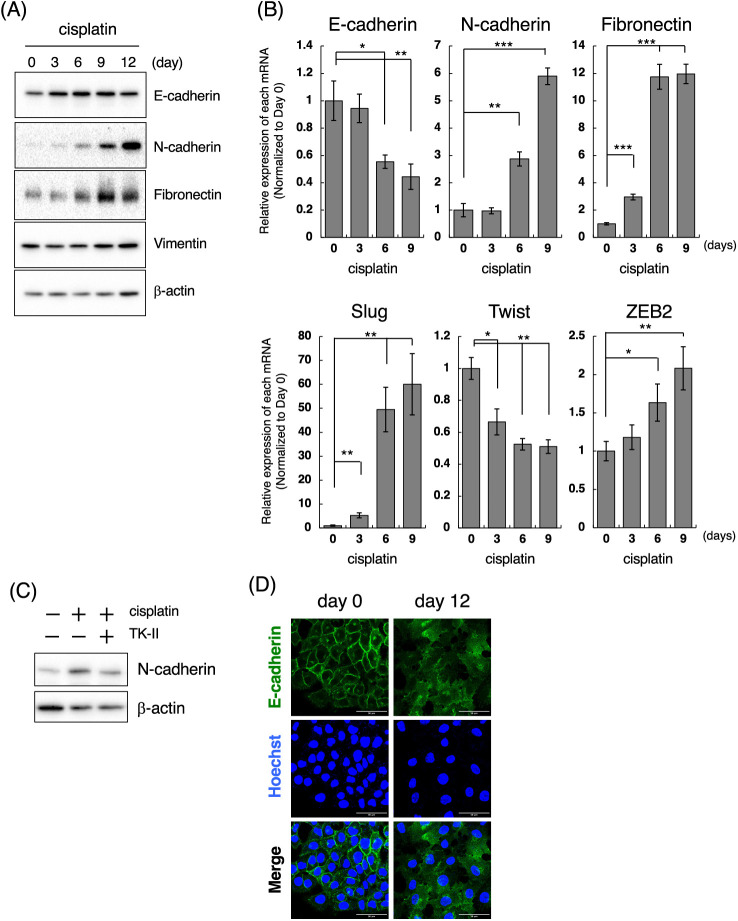
Figure 3. Cisplatin induces the mesenchymal-like phenotypic change. (A) Changes in the protein expression of EMT markers after the treatment of LoVo cells with cisplatin. LoVo cells were treated with 1 μM cisplatin for the indicated periods (0, 3, 6, 9, and 12 days). The protein expression of E-cadherin, N-cadherin, Fibronectin, Vimentin, and β-actin was detected by western blotting. Images are representative of two independent experiments. (B) The effect of cisplatin on mRNA expression of EMT markers in LoVo cells. LoVo cells were treated with 1 μM cisplatin for the indicated periods (0, 3, 6, and 9 days). The levels of E-cadherin, N-cadherin, Fibronectin, Slug, Twist, and ZEB2 mRNAs were evaluated using qPCR. The presented data are normalized to Day 0. All data are representative of three independent experiments and presented as mean SD ± (n = 3). *p < 0.05, **p < 0.01, ***p < 0.001 (two-tailed Student’s test). (C) The TβRI kinase inhibitor suppressed cisplatin-induced N-cadherin upregulation in LoVo cells. LoVo cells were treated with 1 μM cisplatin and/or 1 μM TK-II. Six days later, the cells were collected and subjected to western blot analysis to detect N-cadherin and β-actin expression. Images are representative of two independent experiments. (D) Cisplatin affects the subcellular localization of E-cadherin. LoVo cells were treated with 1 μM cisplatin. Twelve days later, the cells were fixed and stained with an anti-E-cadherin antibody. Subcellular localization of E-cadherin was observed using confocal laser scanning microscope. Images are representative of two independent experiments. Scale bar, 50 μm.

Figure 3