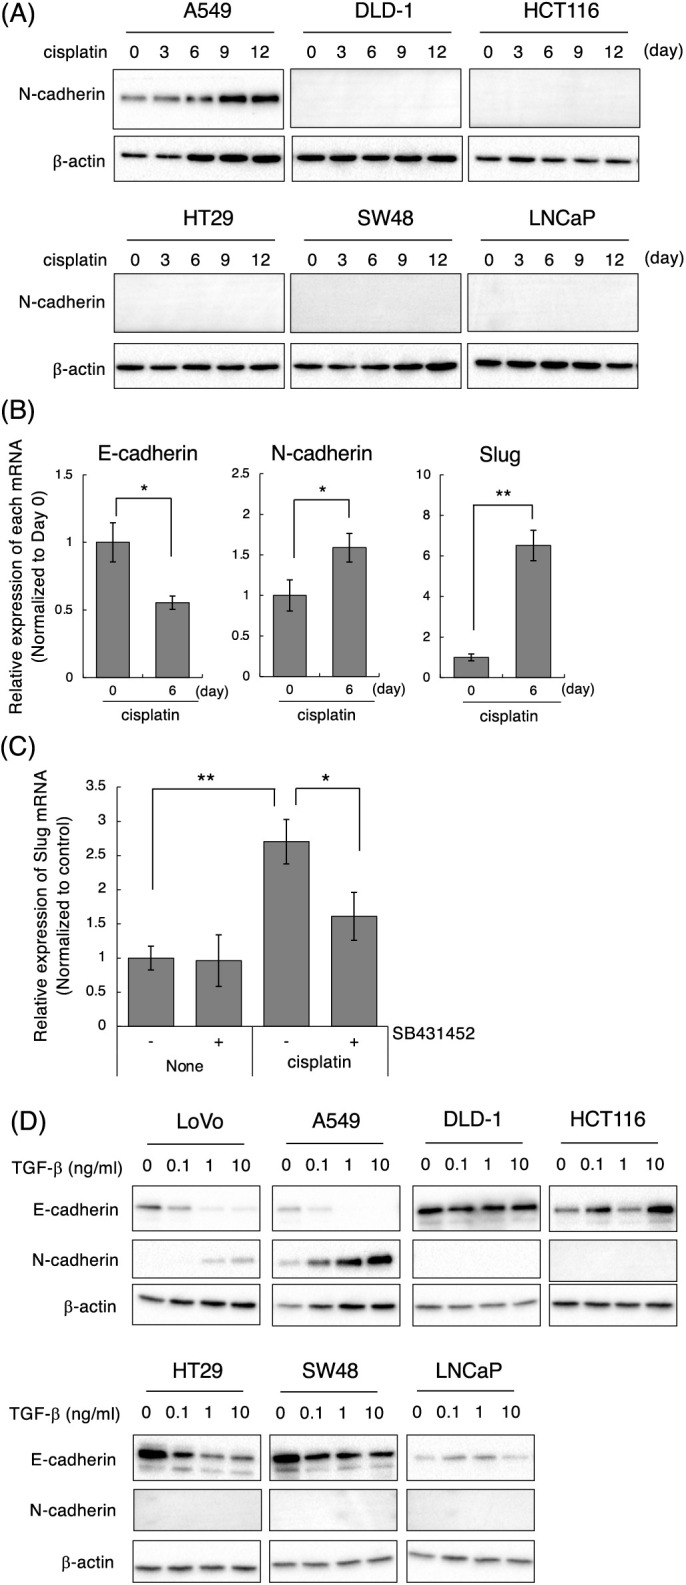
Figure 4. Effect of cisplatin on various types of cancer cell lines. (A) Cisplatin enhanced N-cadherin expression in A549 but not in DLD-1, HCT116, HT29, SW48, and LNCaP cells. Cells were treated with 1 μM cisplatin for the indicated periods (0, 3, 6, 9, and 12 days). The protein expression of N-cadherin and β-actin was detected by western blotting. Images are representative of two independent experiments. (B) Cisplatin decreased E-cadherin mRNA, and increased N-cadherin and Slug mRNAs in A549 cells. A549 cells were treated with 1 μM cisplatin for the indicated periods. The amount of E-cadherin, N-cadherin, and Slug mRNAs were evaluated using qPCR. The presented data are normalized to Day 0. All data are representative of three independent experiments and presented as mean SD ± (n = 3). *p < 0.05 and **p < 0.01 (two-tailed Student’s test). (C) The TβRI kinase inhibitor, SB431452, partially suppressed cisplatin-induced Slug upregulation in A549 cells. A549 cells were treated with 10 μM cisplatin and/or 1 μM SB431452. Twenty-four hours later, the cells were collected and subjected to qPCR analysis to detect Slug mRNA. The presented data are normalized to control cells. All data are representative of three independent experiments and presented as mean SD ± (n = 3). *p < 0.05 and **p < 0.01 (two-tailed Student’s test). (D) TGF-β1 induces and decreases N-cadherin and E-cadherin in LoVo and A549 cells. Cells were stimulated with the indicated concentrations of TGF-β1 (0, 0.1, 1, 10 ng/mL). Two days later, the cells were collected and subjected to western blot analysis to detect E-cadherin, N-cadherin, and β-actin.