. 2023 Oct 16;30(1):198–208. doi: 10.1158/1078-0432.CCR-23-1317

Figure 2.

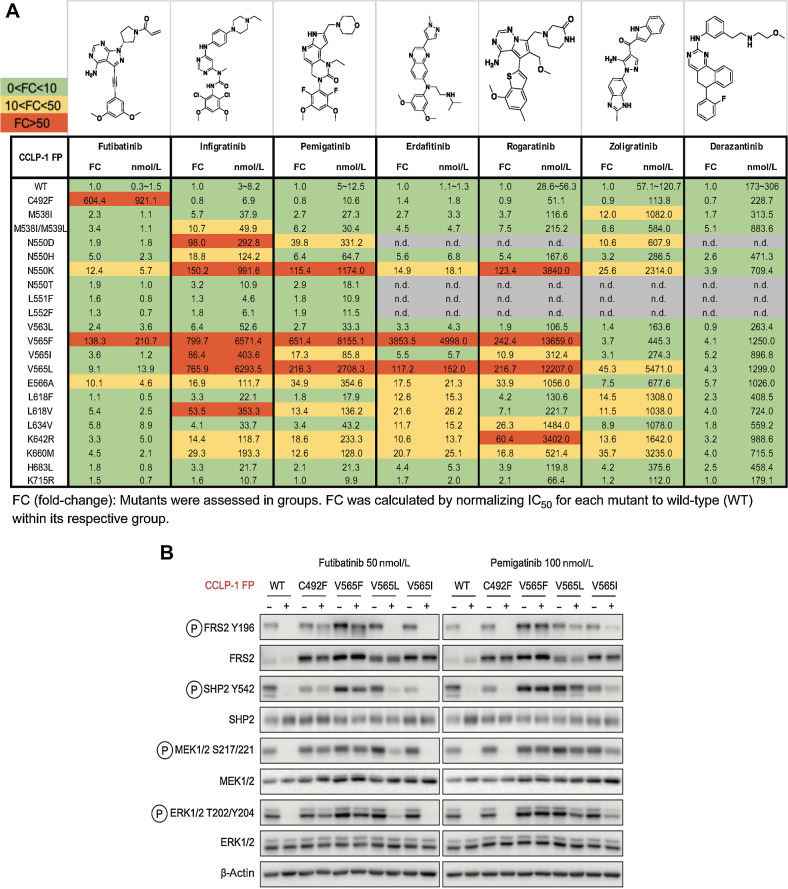
Figure 2. FGFR inhibitors show differential activity profiles against the spectrum of clinically observed FGFR2 kinase domain mutations. A, Activity profiles of the indicated FGFR kinase inhibitors against FGFR-dependent CCLP-1 cells expressing the FGFR2-PHGDH fusion (FP) with a WT kinase domain or with different FGFR2 kinase domain mutations. The table reports IC50 values and fold changes. Mutants were tested in groups. FC denotes fold-change of IC50 for FGFR2 mutant normalized to the IC50 for the WT kinase within an individual group. Each value was representative of the mean of two biological replicates. B, Immunoblot analysis of signaling proteins in CCLP-1 cells engineered to express the indicated FGFR2-PHGDH fusion alleles. Cells were treated with vehicle, 50 nmol/L futibatinib, or 100 nmol/L pemigatinib for 4 hours. (A, Created with ChemDraw.)

FGFR inhibitors show differential activity profiles against the spectrum of clinically observed FGFR2 kinase domain mutations. A, Activity profiles of the indicated FGFR kinase inhibitors against FGFR-dependent CCLP-1 cells expressing the FGFR2-PHGDH fusion (FP) with a WT kinase domain or with different FGFR2 kinase domain mutations. The table reports IC50 values and fold changes. Mutants were tested in groups. FC denotes fold-change of IC50 for FGFR2 mutant normalized to the IC50 for the WT kinase within an individual group. Each value was representative of the mean of two biological replicates. B, Immunoblot analysis of signaling proteins in CCLP-1 cells engineered to express the indicated FGFR2-PHGDH fusion alleles. Cells were treated with vehicle, 50 nmol/L futibatinib, or 100 nmol/L pemigatinib for 4 hours. (A, Created with ChemDraw.)