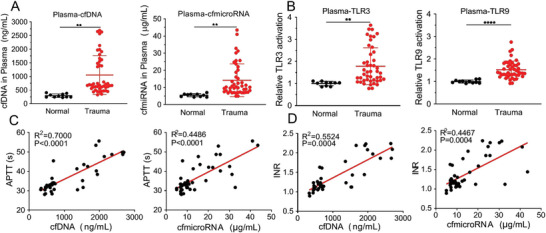
Figure 2.

The relationship between cfNAs and features of trauma patients. A) The levels of cfDNA and cfmiRNA in plasma from healthy volunteers (n = 10) and trauma patients (n = 46). B) Relative TLR3 and TLR9 activation in plasma from healthy volunteers (n = 10) and trauma patients (n = 46). C) The correlation between the cfDNA, cfmiRNA, and APTT plasma levels of trauma patients. (n = 46) D) The correlation between the cfDNA, cfmiRNA, and INR plasma levels of trauma patients. (n = 46) Data represent the mean ± S. D. (** p < 0.01, *** p < 0.001).
