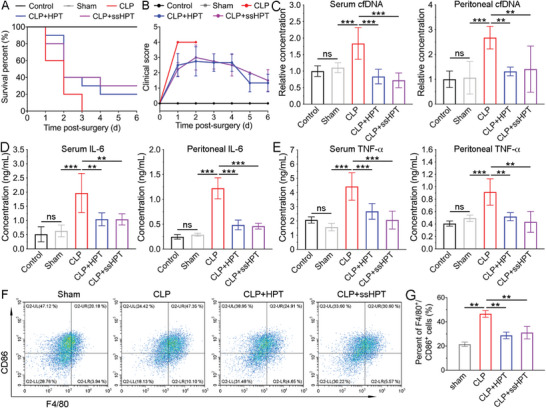
Figure 7.

A) Survival rate and B) clinical score of mice in different treatment groups were recorded for 6 days after CLP. (n = 10) The levels of C) cfDNA, D) IL‐6, and E) TNF‐α were measured in and peritoneal fluid in different treatment groups at 24 h post‐CLP (n = 6). F) Flow cytometry and G) quantitative analysis of M1 macrophages in the peritoneal fluid of CLP mice in different treatment groups. Data represent the mean ± S. D. (n = 3, *p < 0.05, **p < 0.01, ***p < 0.001).
