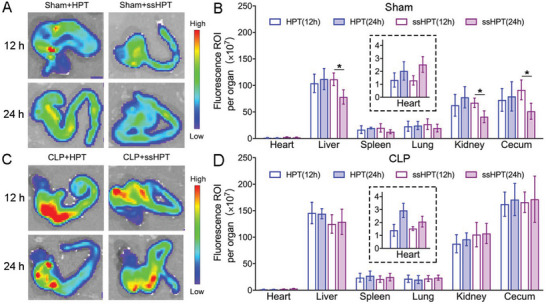
Figure 9.

Biodistribution and biodegradation of HPT and ss‐HPT in sham mice and CLP mice. A) Ex vivo fluorescence images of ceca and B) quantitative assessment of therapy distribution in major organs of sham mice after 12 and 24 h treatment with HPT and ss‐HPT. C) Ex vivo fluorescence images of ceca and D) quantitative assessment of therapy distribution in major organs of CLP mice after 12 and 24 h treatment with HPT and ss‐HPT. Data represent the mean ± S. D. (n = 3, *p < 0.05).
