
Figure 6.
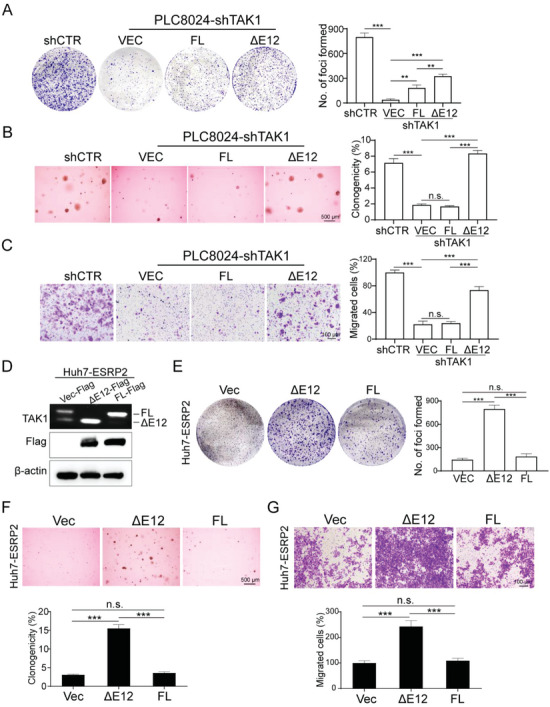
TAK1 isoforms differ in their biological functions. A–C) TAK1 was knocked down by the specific shRNA in PLC8024 cells, and the TAK1_FL or TAK1_ΔE12 isoforms were overexpressed individually. Representative images of foci formation (A), colony formation in soft agar (B), and cell migration (C) induced by indicated cells were shown in the left panel. The numbers of foci, colonies, and migrated cells were illustrated in the bar chart, respectively (right panel). D) Flag‐tagged TAK1_FL or TAK1_ΔE12 were transfected into ESRP2‐overepxressed Huh7 cells. RT‐PCR and western blot were used to validate the isoforms expression. β‐actin was used as loading control. E–G) Representative images of foci formation (E), colony formation in soft agar (F), and cell migration (G) induced by indicated cells. The numbers of foci, colonies, and migrated cells were demonstrated in the bar chart, respectively. Statistics: In Figure 6A–G, data were shown as mean ± SD, and student's t‐test was used for statistical analysis, ** p< 0.01, *** p< .001, n.s., nonsignificant. Data represent at least three independent experiments.