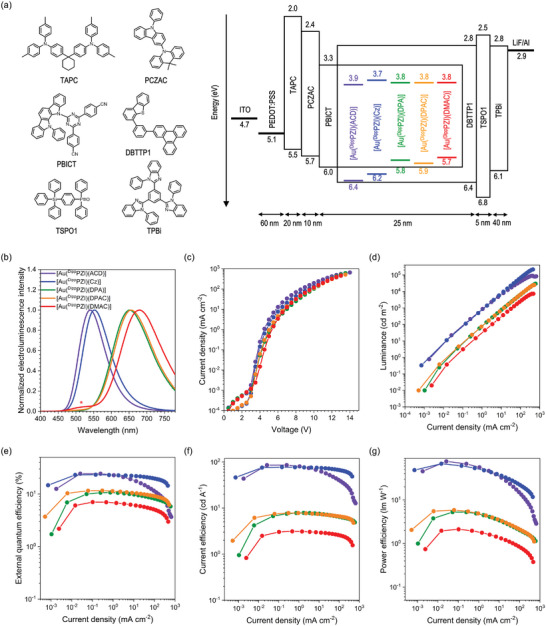
Figure 6.

a) The configuration of the electroluminescence devices tested, and the chemical structures of constituent materials. b) Normalized electroluminescence spectra. The shoulder band marked with a red asterisk is due to the host emission. c) Current density−voltage curves. d) Luminance−current density curves. e) External quantum efficiency−current density curves. f) Current efficiency−current density curves. g) Power efficiency−current density curves.
