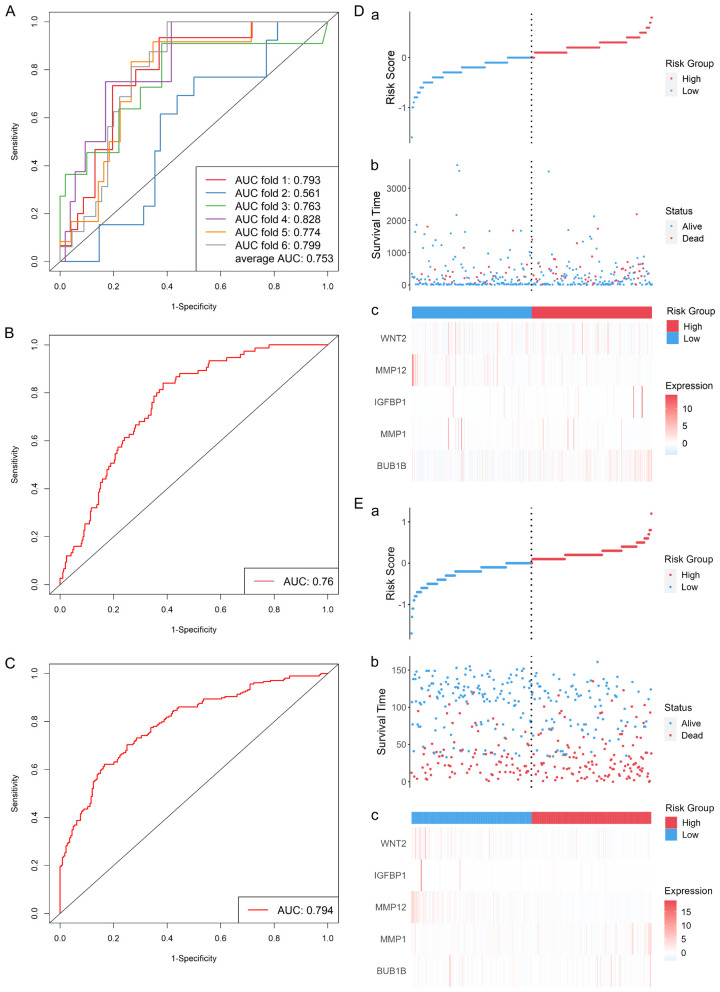
Figure 3.
Survival risk model performance in TCGA-STAD (A, B, D) and GSE84437 (C, E) cohort. (A) ROC curves of six-fold cross-validation. (B) ROC curve of the SRPRM in TCGA-STAD data. (C) ROC curve of the SRPRM in GSE84437 data. (D) Analysis of the predictive value of the model in TCGA-STAD cohort and (E) GSE84437 cohort. ROC: receiver operating characteristic; SRPRM: senescence-related prognostic survival risk model.

