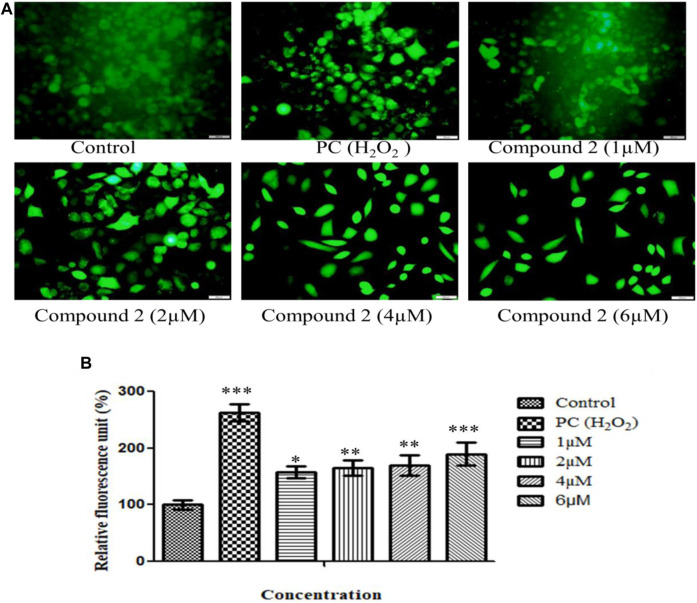
FIGURE 6.
(A) Intracellular ROS production induced by compound 2 in A-549 cells: The cells were cultured for 48 h in the presence of 10% FBS. At 24 h, cells were treated with different concentrations (1, 2, 4, and 6 µM) of compound 2. H2O2 was taken as a positive control (0.05%). At 48 h, cells were stained with DCFDA dye, and ROS levels were measured using Olympus IX53. Fluorescence at each time point was normalized to untreated control cells; (B) Representative histograms showing fluorescence changes in A-549 cells after treatment with various concentrations of compound 2 as determined by the Olympus IX53 microscope. Fluorescent data normalized to positive control showing the average of three experiments. Data are expressed as mean ± S.D. The statistical significance of data was determined by one-way analysis of variance (ANOVA) (*p < 0.05, **p < 0.01, and ***p < 0.001).

