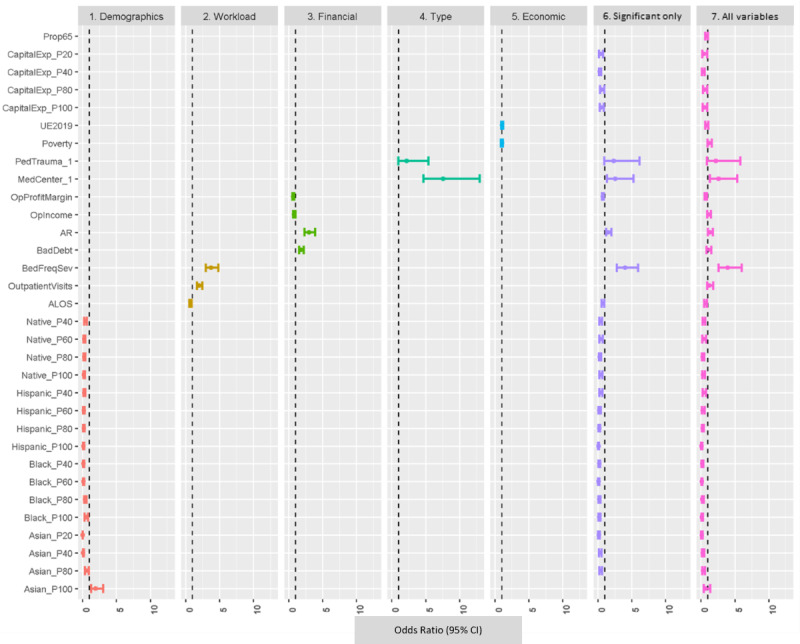
Figure 8.

Forest plot of odds ratios for model 1 and submodels. P20 through P100: the quantiles for each of the discretized variables. ALOS: average length of stay; AR: accounts receivable; BedFreqSev: bed frequency and severity; CapitalExp: capital expenditures; MedCenter: medical center; Native: American Indian; OPIncome: operating income; OPProfitMargin: operating profit margin; PedTrauma: pediatric trauma; Poverty: poverty by county; Significant only: significant only model; UE219: unemployment in 2019.
