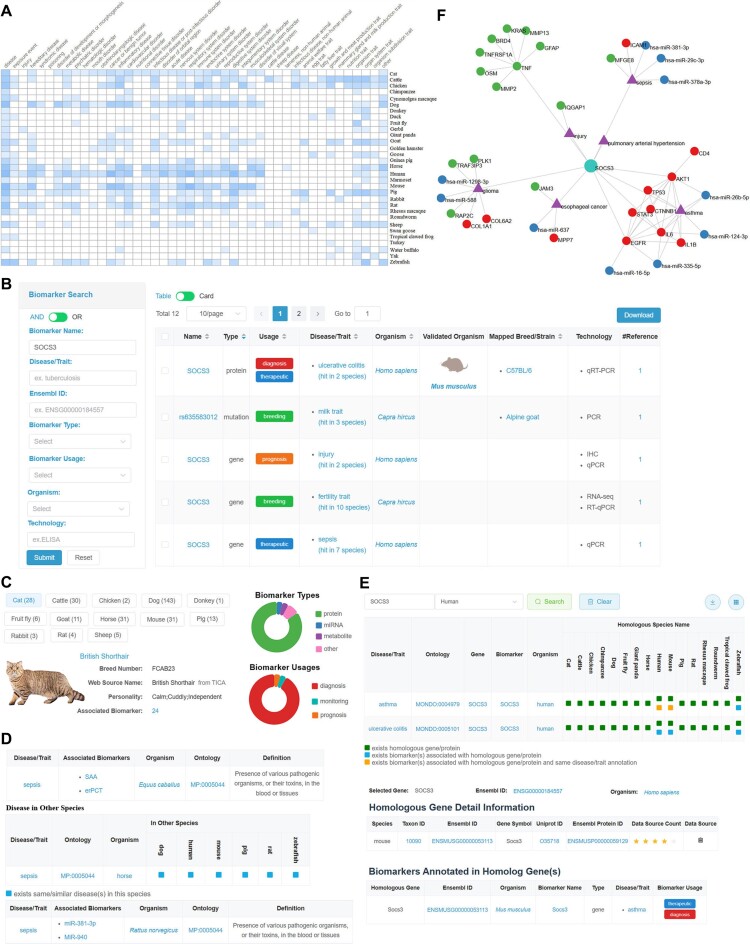
Figure 2.
Screenshots of BioKA. (A) A global profile presenting biomarkers across 31 species. (B) The biomarker list for SOCS3 is sorted by type in descending order, and a filter panel for results filtering. (C) The breed/strain list, and a statistical pie chart for biomarker type and usage respectively. (D) The disease/trait table list, and a summarized panel showed in sepsis detailed information page for associated biomarkers discovered in seven species. (E) Homologs annotated with biomarker disease/trait information. (F) A knowledge graph is constructed based on the annotated information of biomarkers and integrated associations in BioKA.

