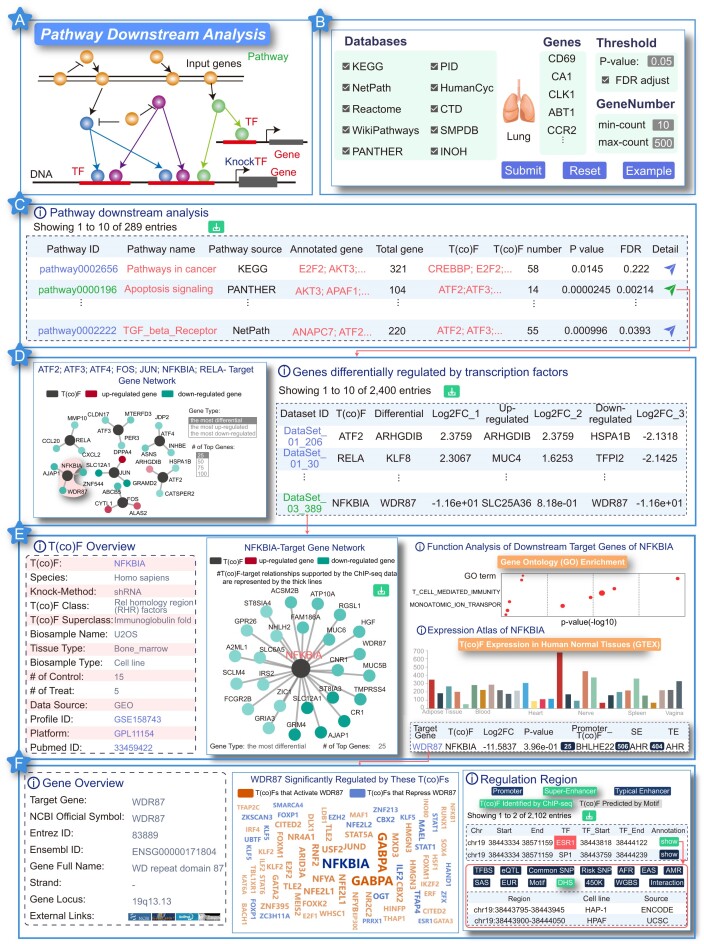
Figure 3.
Results of ‘Pathway Downstream Analysis’ function. (A) Model diagram of pathway analysis. (B) User input 2833 differentially expressed genes associated with pulmonary hypertension. (C) Results overview for ‘Pathway Downstream Analysis’ function. (D) When clicking on the ‘detail’ button, target genes of the terminal TFs could be found. (E) Details of the TF and their target genes in the corresponding T(co)F knockdown/knockout datasets could be viewed by clicking on ‘Dataset ID’. (F) Detailed information on the target gene overview and the abundant (epi)genetic annotations could be viewed by clicking on ‘Target Gene’.

