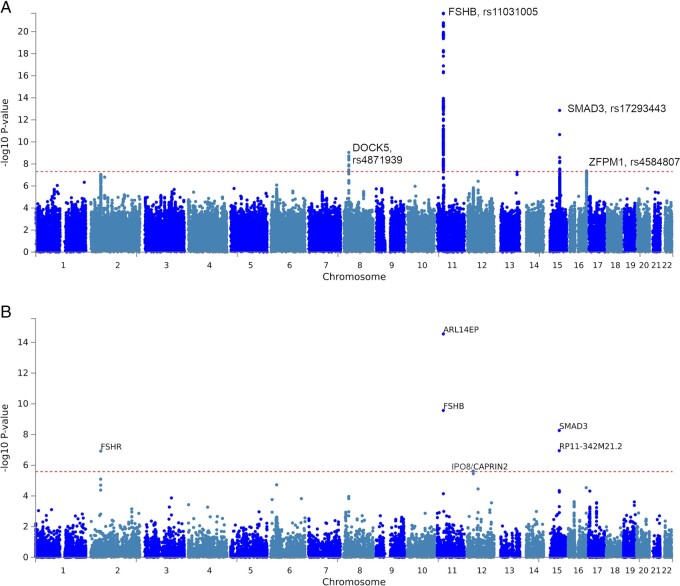
Figure 1.
Association results of the genome wide association study (GWAS) meta-analysis of dizygotic (DZ) twinning versus controls. (A) Manhattan plot of single nucleotide polymorphisms (SNP) associations. The -log10 p value (y-axis) for the SNPs are plotted against their physical chromosomal position (x-axis). The dashed red line represents the genome-wide level of significance (P value< 5 × 10⁻⁸). The rs numbers and gene name indicate the chromosomal region attaining genome-wide significance. For plotting purposes, overlapping data points are not drawn for filtered SNPs with a P-value ≥1 × 10⁻⁵. (B) Manhattan plot of gene-based association results as computed by MAGMA. The -log10P value (y-axis) for the genes are plotted against their physical chromosomal position (x-axis). Input SNPs were mapped to 19171 protein coding genes. Genome-wide significance (red dashed line in the plot) was defined at P = 0.05/19171 = 2.61 × 10⁻⁶.

