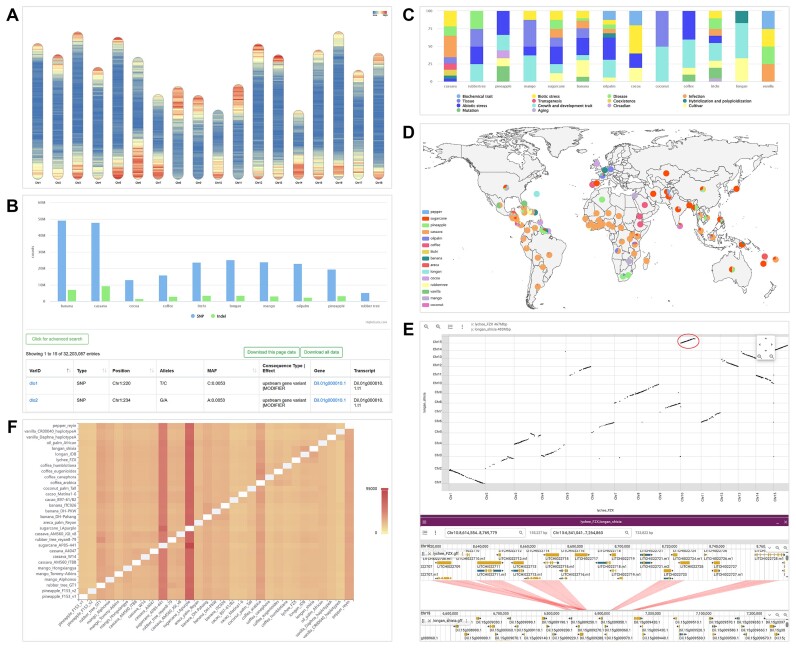
Figure 2.
Screenshots of TCOD. (A) Gene density distribution in the genome of rubber_tree_reyan8-79. (B) Genome-wide variation maps for 10 species. (C) Classification of RNA-Seq studies. (D) Global distribution map of multiple tropical crops. (E) Visualizing collinearity between the genomes lychee_FZX and longan_shixia, the red circle indicates the selected region for a more detailed linear synteny view. (F) Heatmap of homologous genes between genome pairs.

