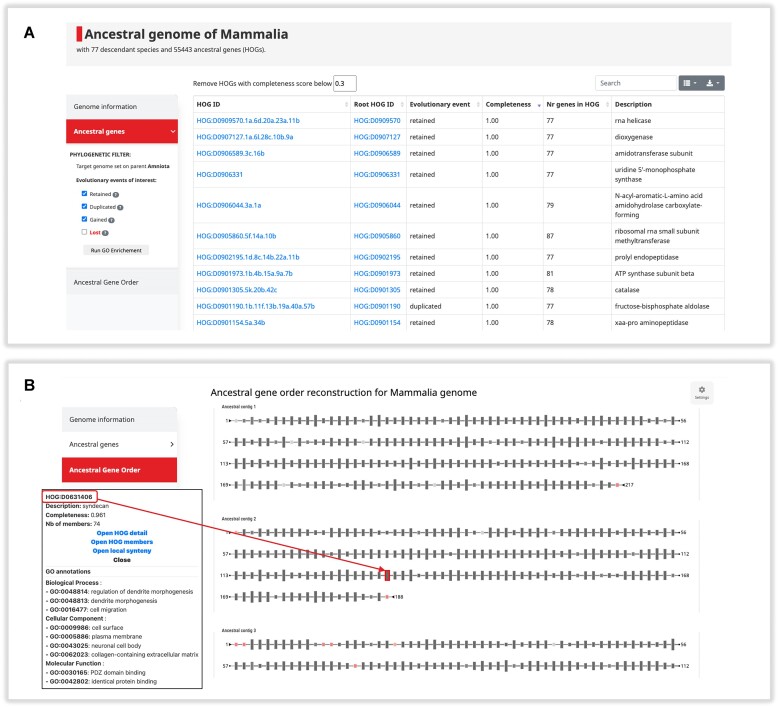
Figure 2.
Ancestral Genome page for Mammalia. (A) Screenshot of the Ancestral Genes table. Here, each row is a HOG, i.e. ancestral gene, at the taxonomic level of interest. For each gene, the HOG identifier for that level and the HOG identifier of the entire gene family (‘Root HOG ID’) is shown. The ‘Evolutionary event’ column reflects if the gene was retained in a single copy, duplicated, or gained (originated) on the branch leading to this taxonomic level. These events can be filtered using the side menu. (B) Screenshot of the Ancestral Gene Order viewer. Here, the reconstructed gene order is shown: HOGs at that taxonomic level are represented as rectangles, connected based on evidence of gene order in the extant genomes. Node color indicates the Completeness Score (0 = red, 1 = dark grey), and node size is the number of extant genes in the HOG.

