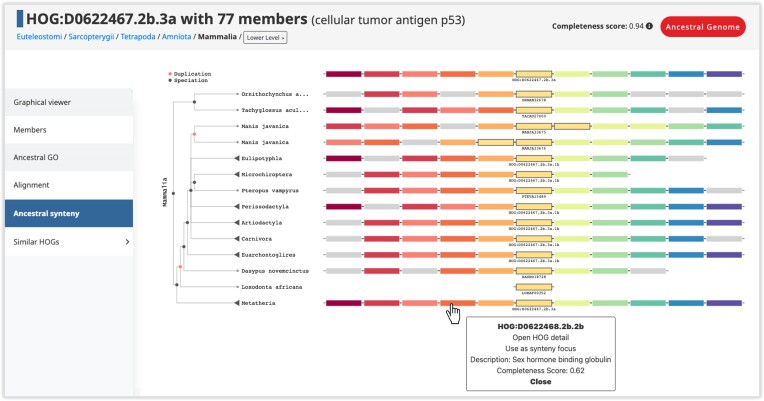
Figure 3.
Ancestral and extant unified local synteny viewer. The boxes represent extant or ancestral genes, with genes of the same color related by homology, i.e. found in the same HOG at the taxonomic level of interest. The focal HOG (or extant gene) and its homologs are outlined in black, with their names shown below. In this example, the focal HOG displayed is the cellular tumor antigen p53 at the Mammalia level. The top row is the reconstructed genomic neighborhood of this gene in the Mammalian common ancestor. The reconciled gene tree is displayed to the left, with the genomic neighborhood of each ancestral or extant genome shown next to it. Duplication nodes are shown in red. The viewer is interactive in that users can collapse nodes on the tree to display the genomic neighborhood in the ancestor corresponding to that node. Clicking on an ancestral gene displays the HOG ID and the functional description of the HOG, and clicking on an extant gene displays the identifiers, sequence length, chromosome, description and the HOG it belongs to.

