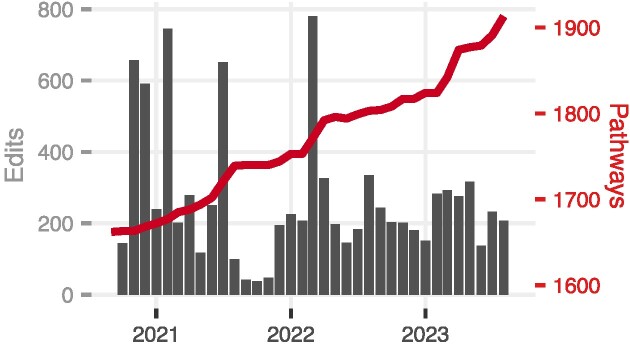
Figure 1.
Recent growth of WikiPathways. The bar plot shows the total number of monthly edits, the line plot shows the total number of pathways in WikiPathways, and the x-axis is years. A dynamically updated version of this plot is available on the front page of the WikiPathways website. Note that the pathway count only includes human-curated content that has been reviewed and merged into the WikiPathways database; we are not counting inferred, converted or incomplete pathways.

