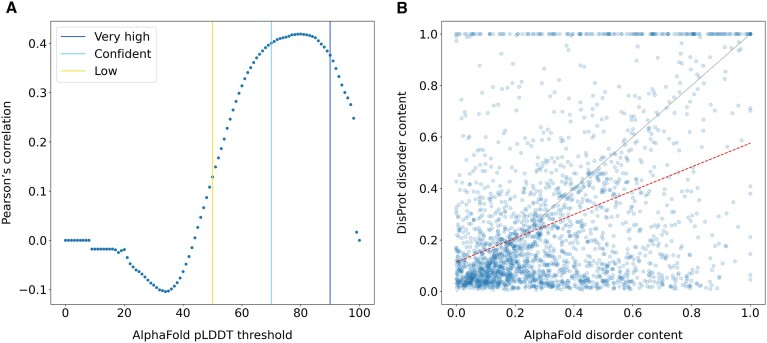
Figure 1.
Comparison of the disorder content at the protein level in DisProt and AlphaFoldDB. The disorder content is calculated as the fraction of disordered residues over the protein sequence length. DisProt disorder content corresponds to the fraction of residues in the consensus, which includes structurally disordered regions. Only DisProt proteins with an AlphaFold structure covering the entire protein sequence in AlphaFoldDB were considered, n = 2356. (A) Correlation of the disorder content between DisProt and AlphaFold when different pLDDT thresholds are selected. (B) Comparison of the disorder content between DisProt and AlphaFold when the AlphaFold pLDDT < 70. The red dotted line represents the linear least-squares regression between the two dimensions, with slope 0.462 ± 0.021 and intercept 0.114 ± 0.009.

