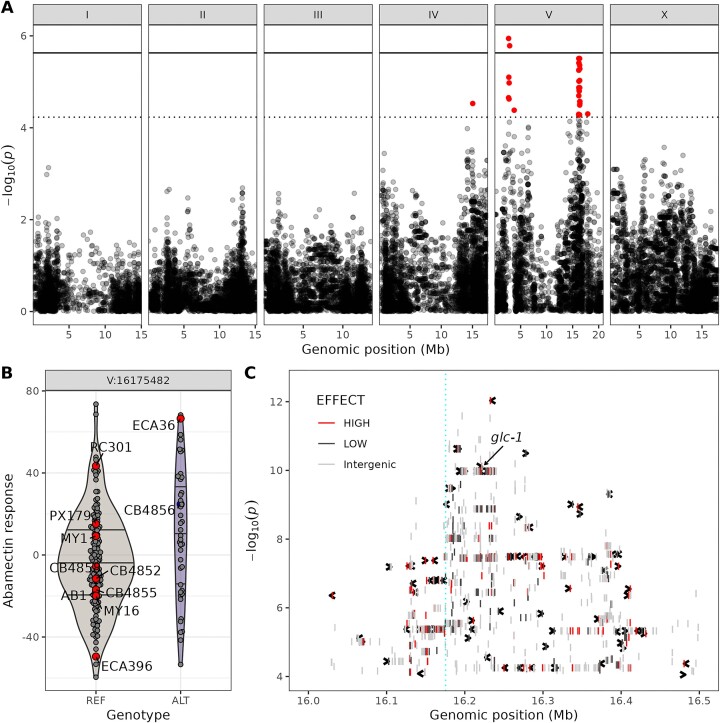
Figure 2.
Elements of the abamectin response GWAS mapping report from CaeNDR. (A) A Manhattan plot is shown to visualize the significance values for all markers used in the statistical test of association between genotype and phenotype. The y-axis is the negative base 10 log of the P-value obtained from the statistical test of association. The x-axis is the genomic position in millions of base pairs and is faceted by chromosome. Markers (SNVs) with a −log10P-value greater than the Bonferroni-corrected significance threshold (solid line) or the genome-wide eigendecomposition significance threshold (dotted line) are significantly correlated with the phenotype and are colored red. Significant markers denote QTL and indicate that genetic variation linked with the marker could cause differences in the phenotype. (B) Violin plots are shown for the most significant marker in the QTL on the right of chromosome V (16.175 Mb). The plot shows the trait values for the strains with the reference (REF) allele compared to the strains with the alternative (ALT) allele for that marker. The abamectin response values shown here are mean centered; the strains with larger values develop better in the presence of abamectin. The horizontal lines indicate the 75th percentile, median and 25th percentile of the data for each genotype. The trait values for some strains are highlighted and labeled because these strains are commonly used to measure dose responses by the community (69–72). A difference in the median trait between the two genotypes is expected for significant markers, and the genotypes of strains at this genomic position can help users plan follow-up experiments to validate the effect of QTL on the trait. (C) A fine-mapping plot is shown to visualize the significance of all bi-allelic SNVs in the QTL interval on the right of chromosome V. The x-axis is the physical position in the genome, and the y-axis is the −log10P-value obtained from a statistical test of association using all SNVs in the interval. The inclusion of all SNVs alters the range of p-values relative to GWAS Manhattan plot. We truncated the axes to focus on the center of the QTL. Each SNV is represented by a vertical line and colored by the predicted variant impact on genes: red = HIGH, black = LOW, gray = INTERGENIC. Genes are represented by black arrows showing the direction of the gene and are positioned on the y-axis based on the maximum −log10P-value of all variants in the gene. The vertical dashed line (cyan) represents the physical position of the most significantly associated SNV identified on the right of chromosome V in the GWAS. The gene gcl-1 is labeled in the plot because natural variation in this gene was previously shown to confer abamectin resistance (52,68).

