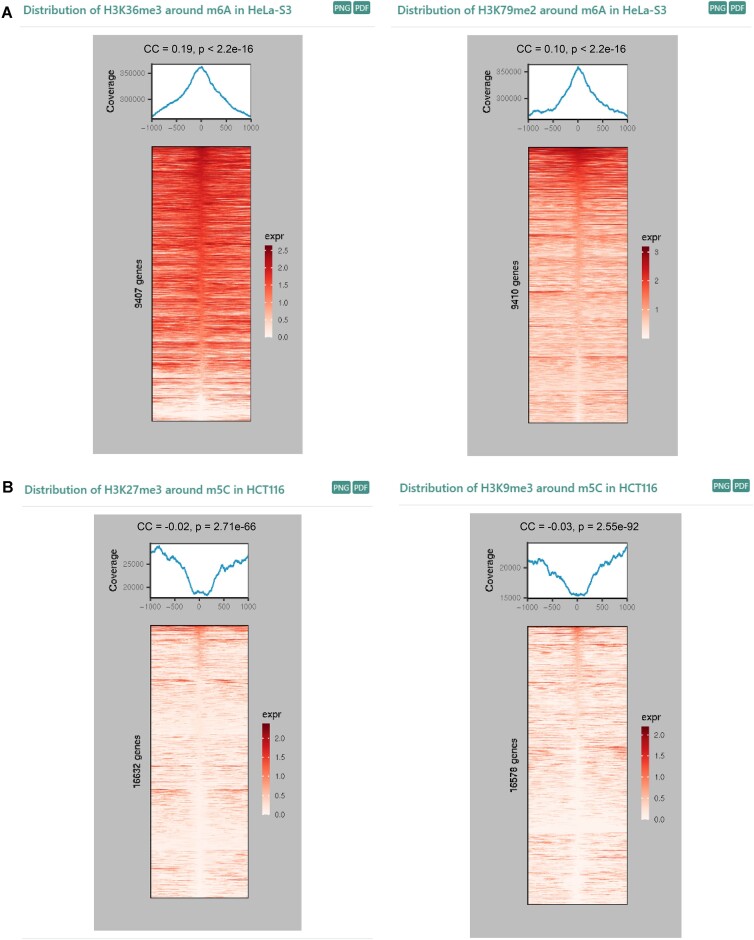
Figure 3.
Distribution correlation of histone modification and RNA modification. (A) Distribution patterns of H3K36me3 and H3K79me2 modifications around m6A sites in RMBase v3.0 in HeLa cell line. (B) Distribution patterns of H3K27me3 and H3K9me3 modifications around m5C sites in RMBase v3.0 in HCT116 cell line. Pearson correlation coefficient (CC) and P-value are used to evaluate the significance of the potential correlation between RNA modifications and histone modifications. The m6A peaks used for Pearson correlation analysis was downloaded from GEO (GSE76414), while the m5C peaks were generated by extending 20 nt upstream and downstream from m5C sites that stored in RMBase v3.0.

